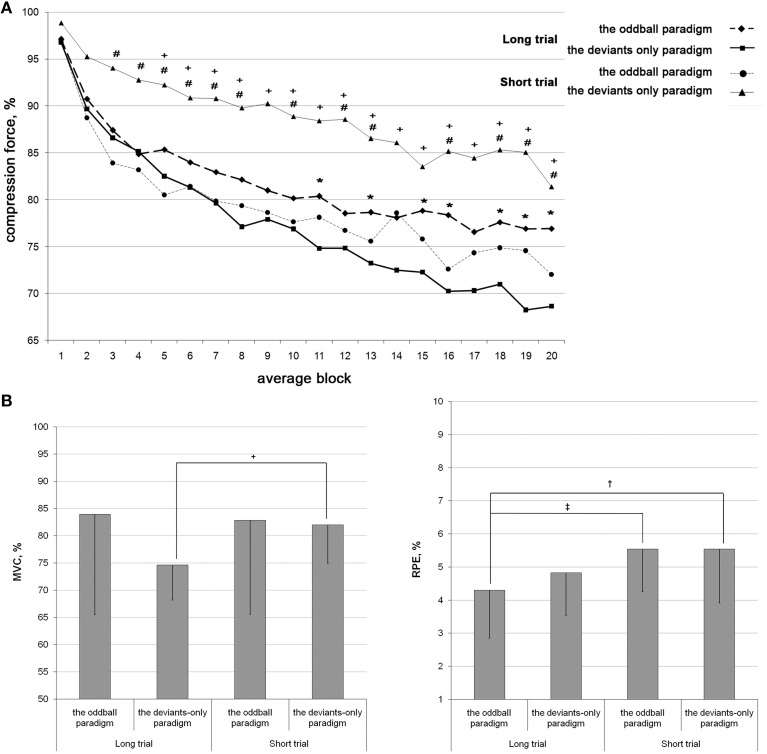
Figure 2.
Fatigue development during the task performance in four conditions with known duration: the LT deviants-only, the LT oddball, the ST deviants-only, and the ST oddball paradigms. (A): The force of short dynamometer compression in response to the target stimulus averaged in series of 10 consecutive values (averaged blocks) and calculated as the percentage of the mean of the first five values. The first 20 blocks of LT and 20 blocks of ST are shown. (B): The MVC and the RPE values calculated as the means, and after that, as the percentage of the first value. The bars indicated the standard deviations. *p ≤ 0.05 between the LT oddball and the LT deviants-only paradigms; #p ≤ 0.05 between the ST oddball and the ST deviants-only paradigms; +p ≤ 0.05 between the ST deviants-only and the LT deviants-only paradigms; ‡p ≤ 0.05 between the LT oddball paradigm and the ST oddball paradigms; †p ≤ 0.05 between the LT oddball and the ST deviants-only paradigms.

