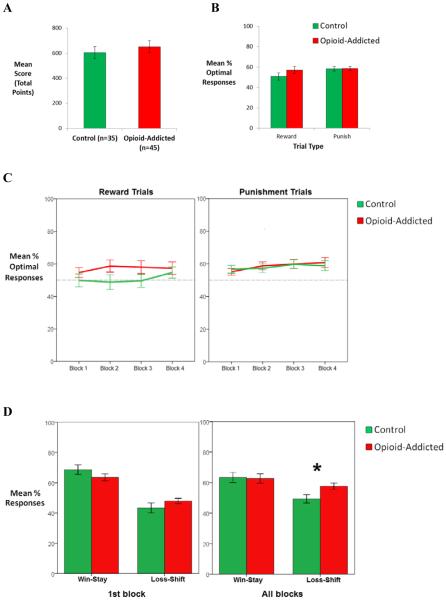
Figure 2.
Behavioral results. There were no differences between control and opioid-addicted groups in (A) total points scored, (B) percent optimal responding on reward-based and punishment-based trials, or (C) learning curve for each trial type across blocks of 20 trials (all F<2.00, all p>0.200). However, (D) the opioid-addicted group showed greater loss-shift behavior in the first block of 20 trials, and across all blocks in the experiment(p=0.001). Error bars represent SEM.

