
Figure 4:
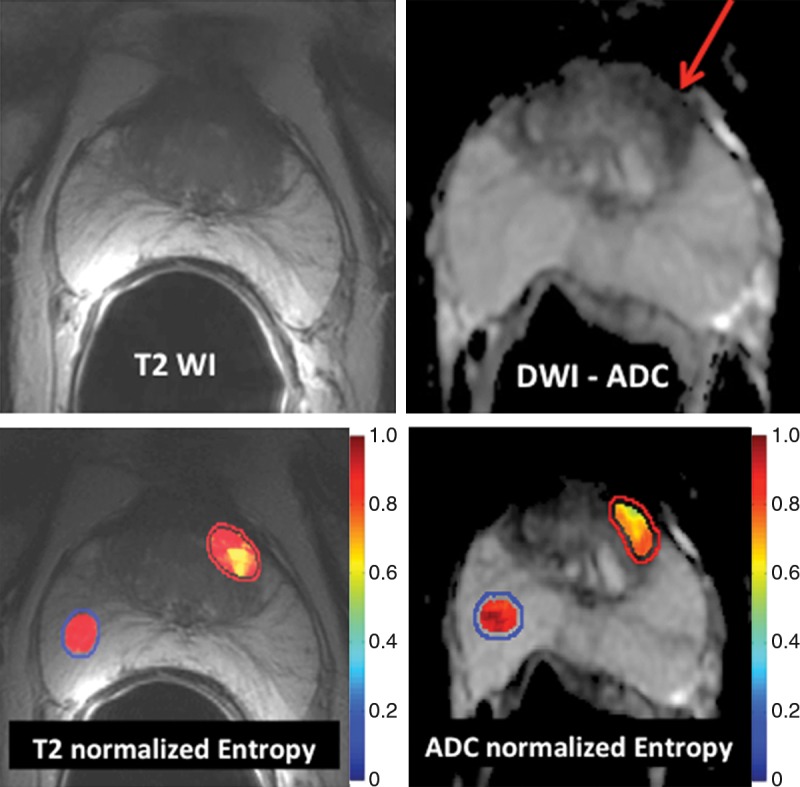
Application of texture analysis to T2-weighted MR images and ADC maps of prostate cancer. A lesion in the transition zone is barely discernible on the T2-weighted image (top left) and has higher conspicuity on the ADC map (top right). Texture features were computed on a per-voxel basis (using a 5 × 5 × 1 pixel window) from manually segmented regions of interest identifying the normal peripheral zone (outlined in blue) and cancer (outlined in red). From the computed texture features, a machine learning method was applied to distinguish between normal and cancerous structures and to stratify the Gleason patterns. Heat map images show clear differences between healthy tissue and cancer and depict intratumoral heterogeneity that may be useful in assessing tumor aggressiveness and informing fused MR imaging–ultrasonography biopsy.