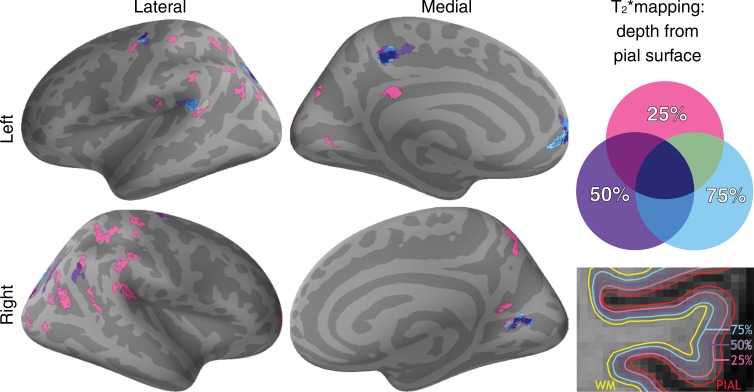
Figure 2:
Overlay of the general linear model significance maps (P < .05, corrected for multiple comparisons) shows clusters of increased cortical T2* in 34 patients with MS relative to 17 healthy control participants at 25%, 50%, and 75% depth from the pial surface. Age and sex were included as adjustment variables.

