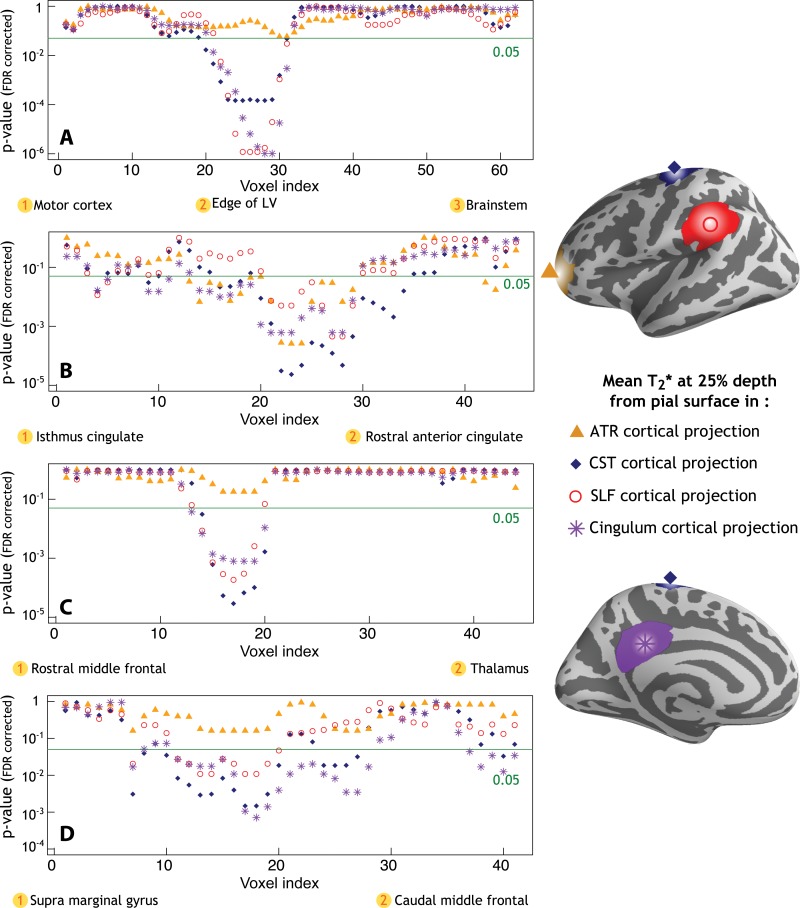
Figure 5:
Profiles of P values along tracts of interest obtained from linear regression models that show in 34 patients with MS a positive correlation between diffusion imaging metrics, including, A, axial diffusivity along the corticospinal tract (CST) and cortical T2*, B, radial diffusivity along the cingulum and cortical T2*, C, radial diffusivity along the anterior thalamic radiation (ATR) and cortical T2*, and D, radial diffusivity along the superior longitudinal fasciculus (SLF) and cortical T2*. LV = lateral ventricle.

