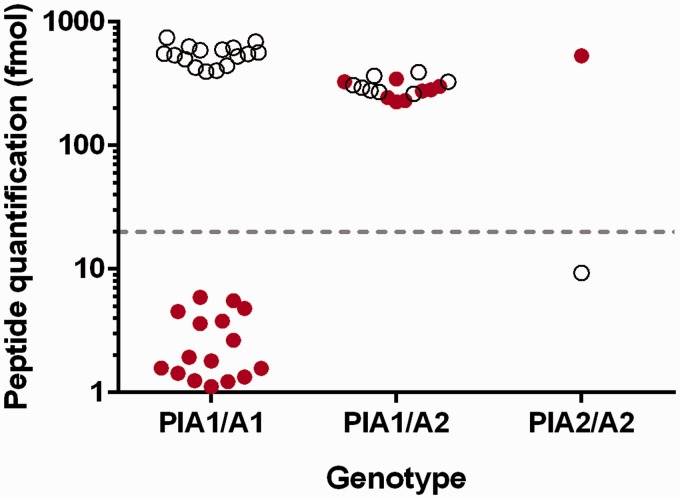
Figure 2.
Peptide expression in healthy subjects based on inferred genotype.
Scatter plot showing the results from peptide quantification in healthy subjects for PlA1/A1 (n = 16), PlA1/A2 (n = 8) and PlA2/A2 (n = 1) genotypes. Open circles represent the PlA1 peptide and filled circles the PlA2 peptide. Dotted line indicates the lower limit of measuring range for the PlA1/A2 peptides, above which peptide quantification can be reliably determined.

