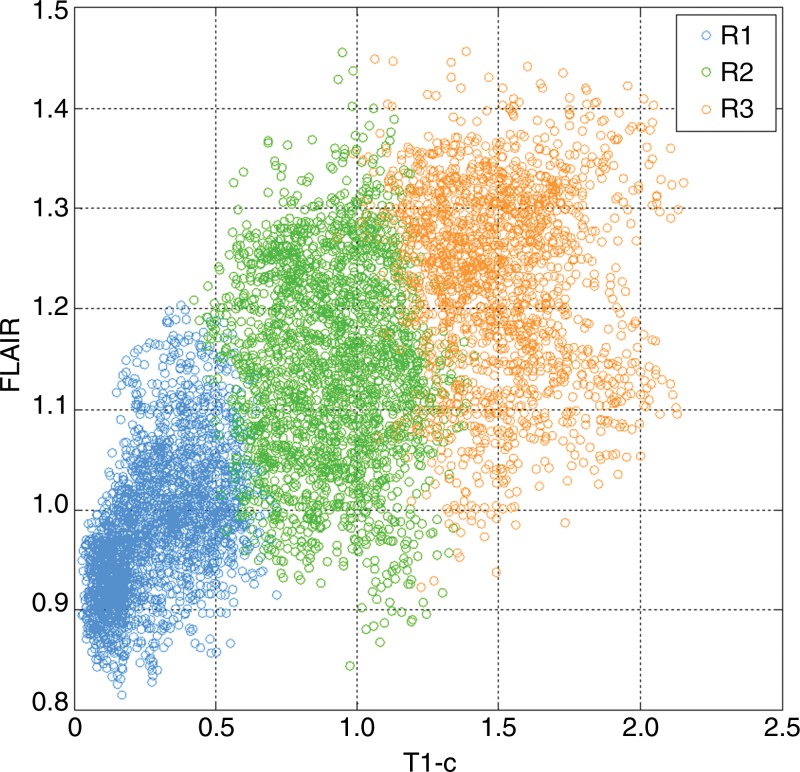
Figure 2:
Graph shows the distributions of postcontrast T1-weighted and FLAIR signal intensity within a tumor, with each voxel color-coded by the subregion to which it belongs according to intratumor segmentation. Regions are ordered by their mean T1-weighted postcontrast signal intensity level. Blue = low signal intensity, green = medium signal intensity, orange = high signal intensity.

