
Table 3.
Imaging Features Selected by Cox Model with LASSO and Corresponding Weights and Ranked by their Dominance in the Model
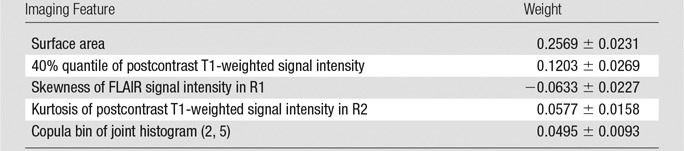
Note.—Data are the mean plus or minus standard deviation. R1 = subregion of hypointense to mildly hyperintense T1-weighted signal intensity, R2 = subregion of moderately hyperintense T1-weighted signal intensity.