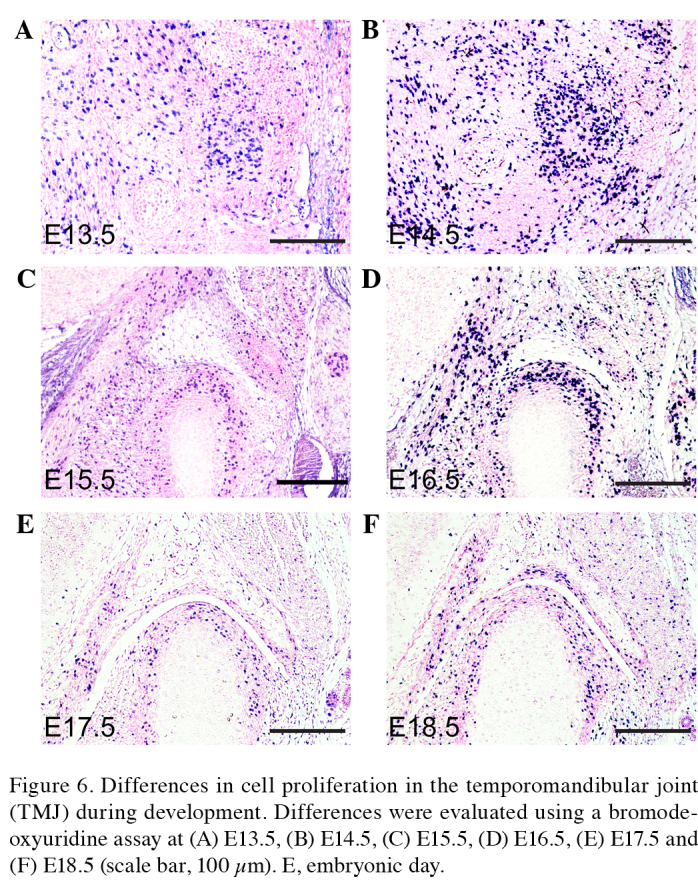
Figure 6.

Differences in cell proliferation in the temporomandibular joint (TMJ) during development. Differences were evaluated using a bromodeoxyuridine assay at (A) E13.5, (B) E14.5, (C) E15.5, (D) E16.5, (E) E17.5 and (F) E18.5 (scale bar, 100 µm). E, embryonic day.
