
Figure 1. Cytotoxicity of DHS.
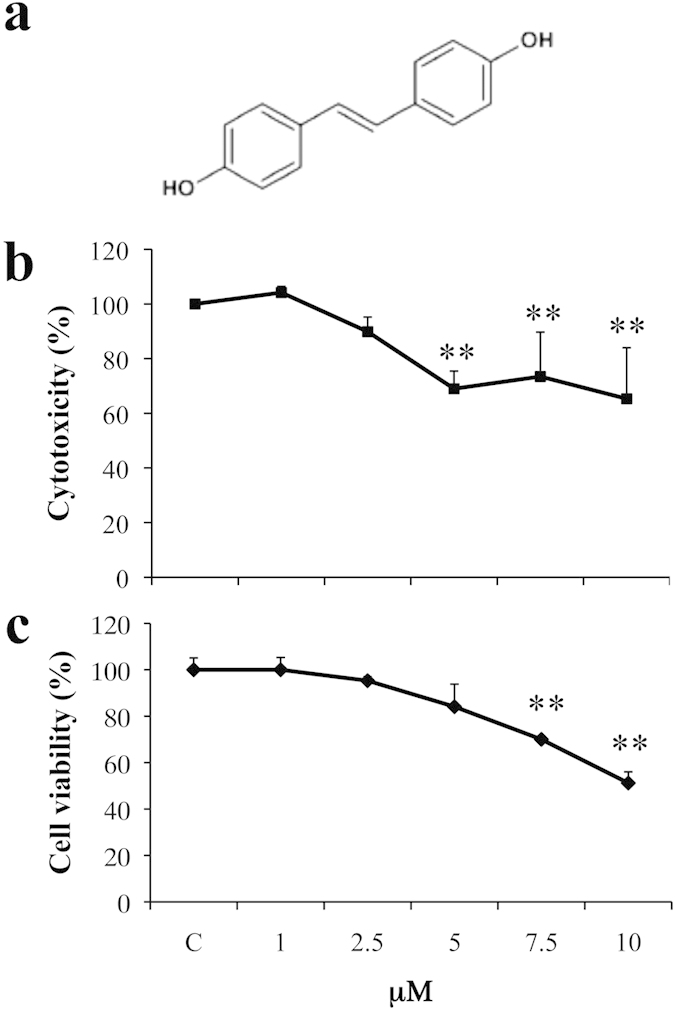
(a) Chemical structure of DHS. (b) The cytotoxicity was determined by the MTT assay after 24 h of treatment with the indicated concentrations of DHS. The reduction of MTT by active mitochondria, which results in a colour change measured at 570 nm with a microplate reader, was used as an indicator of viable cell number. (c) Cell viability was determined by the Trypan Blue staining. Unstained (viable) and stained (non-viable) cells were counted in a Burker chamber, and the results were expressed as a percentage of viable versus the total number of counted cells. Data are the means ± SD from at least three independent experiments: values are expressed as percentages and are relative to untreated control cells (**p ≤ 0.01 compared with control cells).