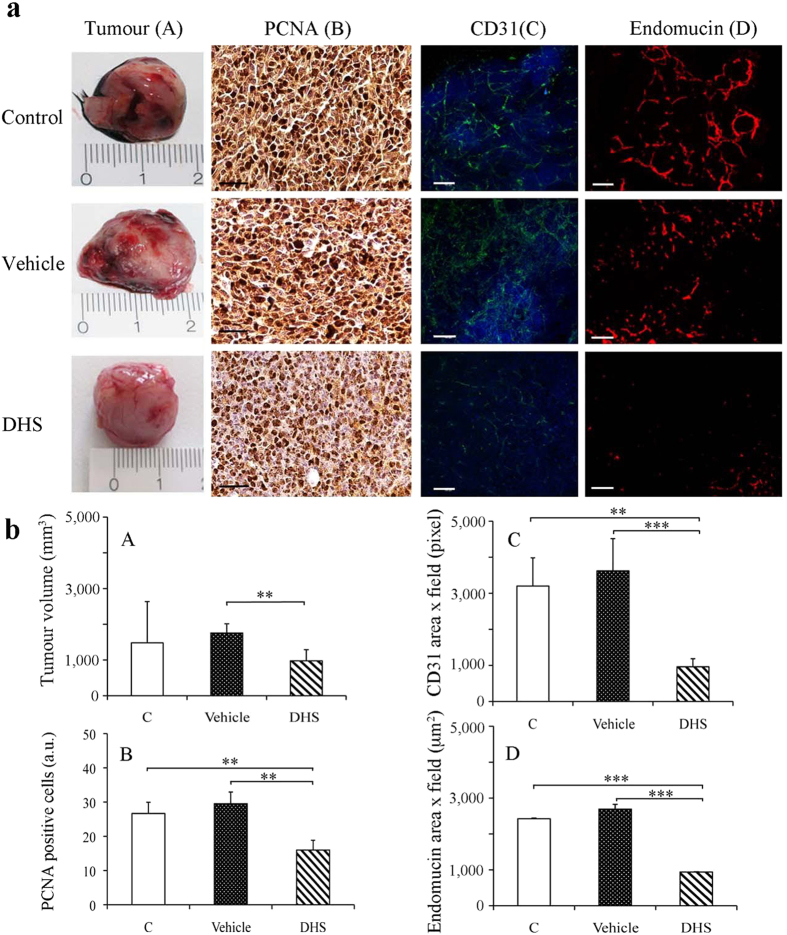
Figure 4. Tumour size and angiogenesis in a mouse model after DHS treatment.
(aA) Macroscopic representative LLC primary tumours in control and 4 weeks DHS- and ethanol-treated mice and the corresponding tumour growth rates (bA). (aB) PCNA representative images obtained after immunostaining of primary tumour masses with PCNA antibody and DAB detection (bar = 50 μm) in control, vehicle- and DHS-treated mice and (bB) the relative quantification of PCNA-stained positive cells. (aC) Representative images of CD31 whole mount staining (bar = 100 μm) and quantification as obtained by confocal microscopy (bC). (aD) Endomucin immunofluorescence staining of primary tumour masses (bar = 100 μm) and relative quantitative analysis (bD). 15–18 mice/group were used; data shown are means ± SEM of 5 independent experiments (n = 5). (*p ≤ 0.05, **p ≤ 0.01 and ***p ≤ 0.001).

