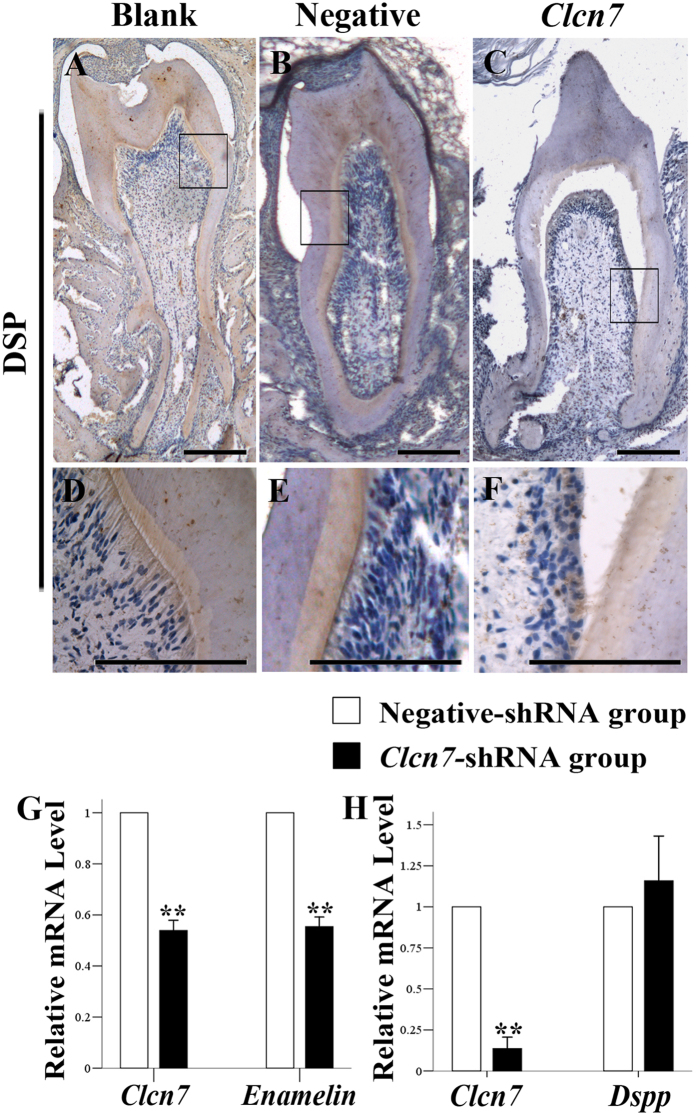
Figure 3. ClC-7’s effect on DSP and Enam expression.
(A–F) Immunohistochemistry staining of DSP in the transplanted tooth. DSP was expressed in the pre-dentin, dentin and the odontoblasts (A~E). In the Clcn7-shRNA group, the expression of DSP was reduced (C,F) compared to the other two groups. (D–F) were partial enlargement of figure (A–C), respectively. Blank = blank control group (A,D); Cont = negative-shRNA group (B,E); Clcn7 = Clcn7-shRNA group (C,F). Scale bars = 200 μm. (G) Real time PCR results in ameloblast LS8 cell line. Compared to the negative-shRNA group (RQ equals one), the RQ values in the Clcn7-shRNA group of Clcn7 and Enam are 0.539 (0.069, P = 0.007) and 0.554 (0.065, P = 0.007), respectively. (H) Realtime PCR results of odontoblast MDPC23 cell line. Compared to the negative siRNA group, the RQ values in the Clcn7-siRNA group of Clcn7 and Dspp were 0.137 (0.069, P = 0.002) and 1.159 (0.273, P = 0.419), respectively.

