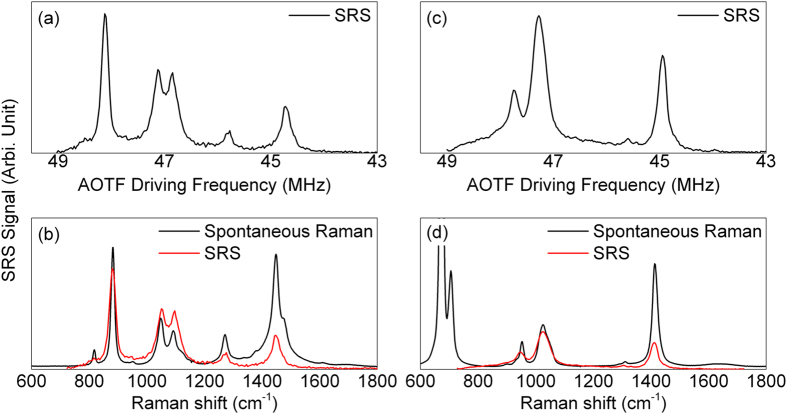
Figure 3.
The stimulated Raman signal detected via AOTF setup for (a) ethanol and (c) an unknown sample (mainly collagen monomers); The comparisons between SRS signal and spontaneous Raman spectrum were shown in (b,d). The relationship between AOTF driving frequency and Raman shift was calibrated using the data shown in Fig. 2.

