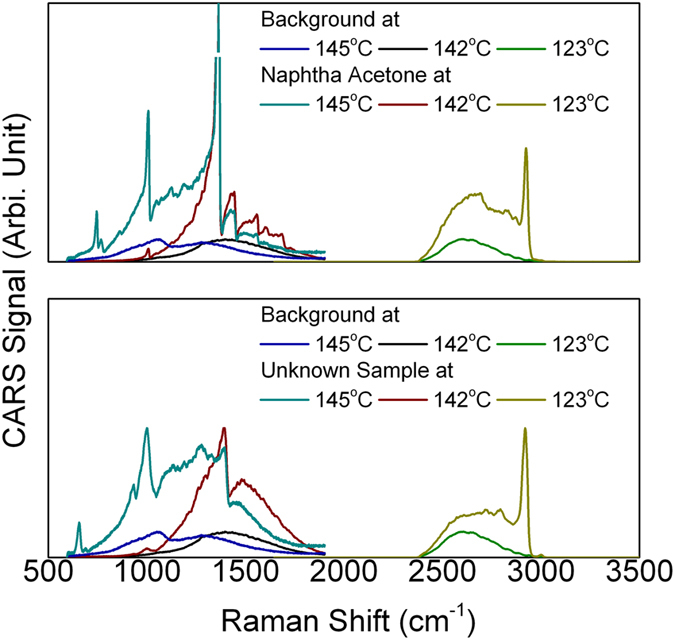
Figure 4. CARS spectrum for acetone (upper) and the unknown sample (lower).

The OPA was heated to different temperature. 3000 cm−1 Raman lines become visible when the OPA temperature was lowered to 123 °C.

The OPA was heated to different temperature. 3000 cm−1 Raman lines become visible when the OPA temperature was lowered to 123 °C.