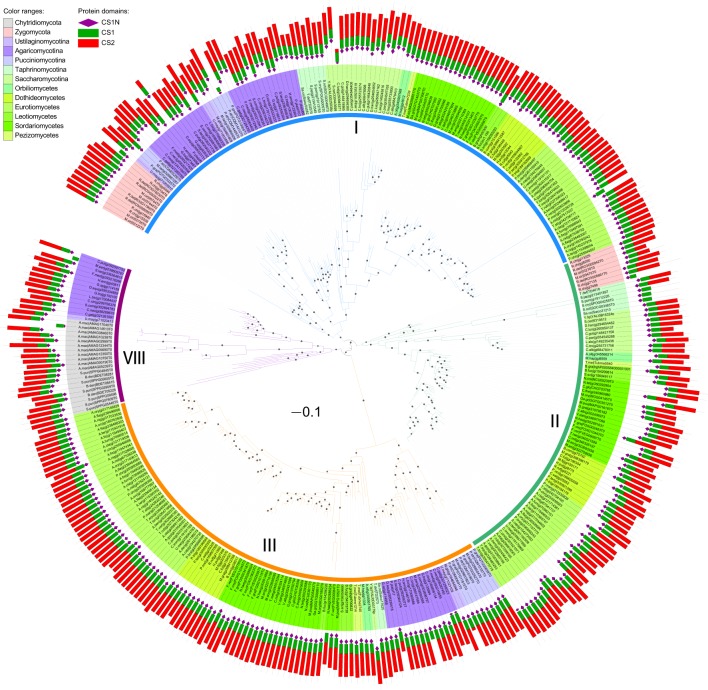
Figure 2.
Maximum likelihood phylogeny of division I CHSs. The phylogenetic tree was constructed using PhyML3.1 (Guindon et al., 2010). The SH-like support of approximate likelihood ratios (aLRT-SH) are plotted as circles on the branches (only SH-like support >0.8 are indicated). Colors of branches indicate corresponding classes. The scale bar corresponds to 0.1 amino acid substitution per site. For abbreviations of fungi, please see Table S1.

