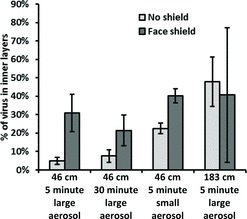
FIGURE 9. Amount of influenza virus that was detected in the inner layers of the respirator, compared to the total amount detected in all layers. These results are plotted as a ratio for ease of interpretation, but the absolute amount of virus collected at 183 cm was significantly less than collected at 46 cm (see Figure 8). Each bar is the average ±SD of 3 experiments.