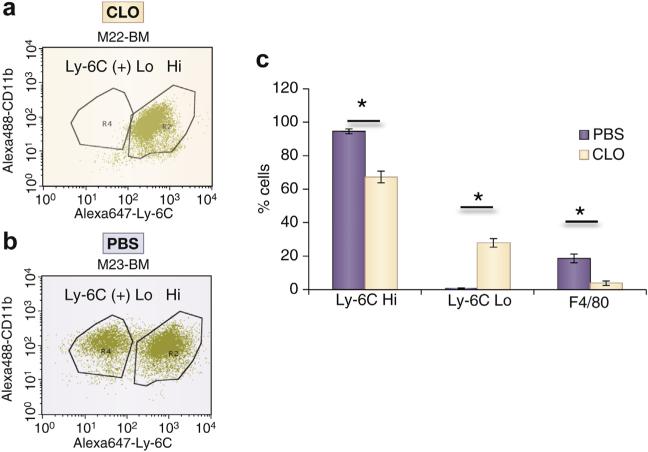
Figure 5. Flow cytometry for bone marrow Ly-6C Hi and Ly-6C Lo cells and splenic F4/80(+) cells from animals treated with CLO and PBS at day 14.
(a) Representative flow diagram from a clodronate (CLO)-treated animal. (b) Representative flow diagram from a control–phosphate-buffered saline (PBS)-treated–animal. (c) Pooled data from 2 PBS-treated animals and 3 CLO-treated animals at day 14. Each bar shows the mean ± SEM of 2 to 3 samples per group. Two-way analysis of variance with Student t test with post hoc Bonferroni correction was performed. *P < 0.05.

