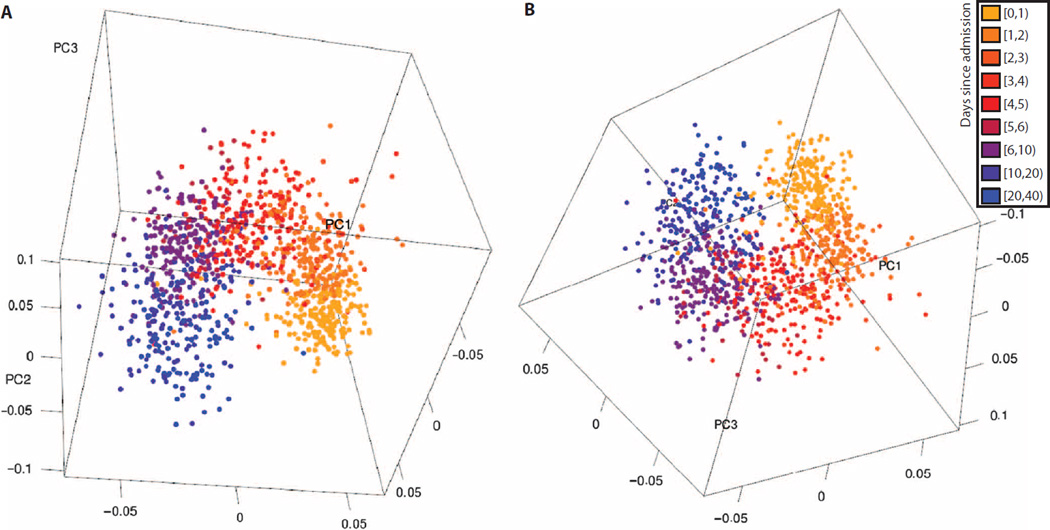
Fig. 2. Two views of the first three principal components of labeled PCA of time-course data sets.
Five peripheral whole-blood gene expression data sets were combined and matched for common genes. The genes with the top 100 orthogonality scores were selected via CUR matrix decomposition, and labeled PCA was performed, broken into classes by day. (A and B) The three-dimensional plots of the first three principal components demonstrate that changes by day explain most variance in the data sets, different data sets show similar changes over time, and the changes over time proceed in a nonlinear fashion. Parts (A) and (B) show two different views of the same data; also see movie S1.

