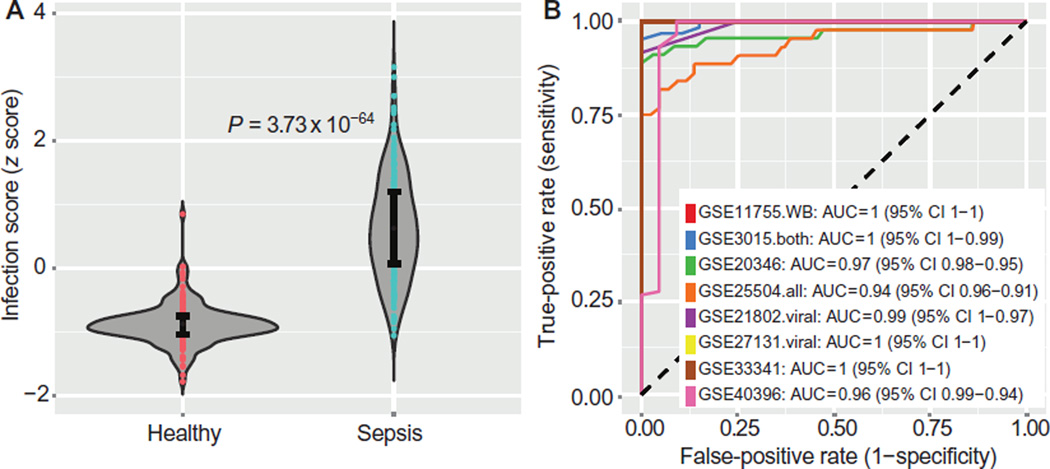
Fig. 6. Discrimination of healthy versus sepsis.
Eight independent validation data sets that met inclusion criteria (peripheral whole blood or neutrophils, sampled within 48 hours of sepsis diagnosis) were tested with the infection z score. (A) Infection z scores for all patients (n = 446) were combined in a single violin plot; error bars show middle quartiles. P values calculated with Wilcoxon rank-sum test. (B) Separate ROC curves for each of the eight data sets discriminating sepsis patients from healthy controls. Mean ROC AUC = 0.98. See Table 6 for further data set details.

