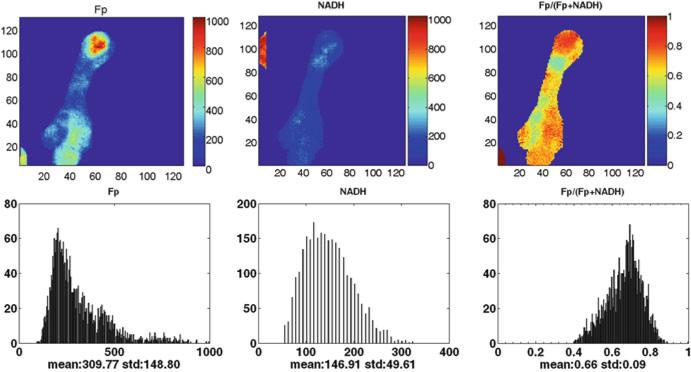
Fig. 48.1.
Typical redox images of breast tumor tissue (patient 1) (image matrix 128 × 128, resolution 40 μm). The redox ratio ranges between 0 and 1; the Fp or NADH images are in the unit of μM. The x axes of the corresponding histograms represent the redox ratio or concentration. The y axes represent the number of pixels in the tumor section having a specific value of redox ratio or concentration

