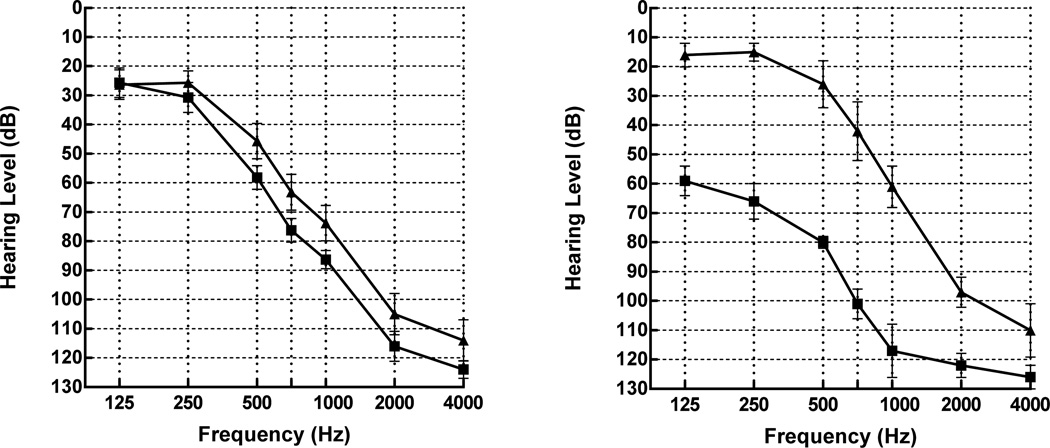
Figure 1.
Figure 1, left. Mean audiometric thresholds for the hearing preservation patients with symmetric, low frequency hearing, n = 8. Squares indicate thresholds for the implanted ear. Error bars indicate +/− 1 SEM. Figure 1, right. Mean audiometric thresholds for the patients with asymmetric, low frequency hearing, n = 4.

