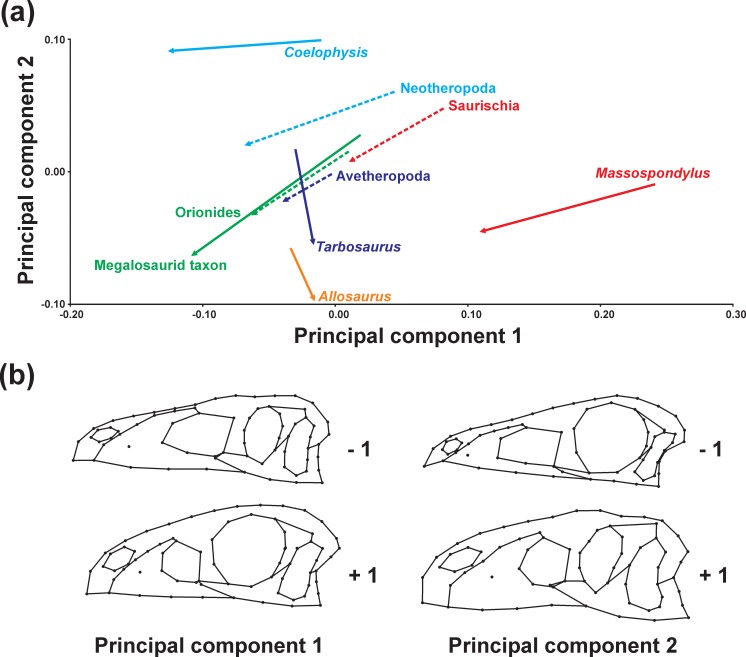
Figure 3. Principal component analysis of ontogenetic trajectories.
(A) Terminal and ancestral ontogenetic trajectories for PC 1 against PC 2. The arrows illustrate the different ontogenetic trajectories, in which the arrowhead marks the position of the adult individual and the base of the arrow indicates the juvenile individual. (B) Illustration of the main shape changes for the first two principal components.

