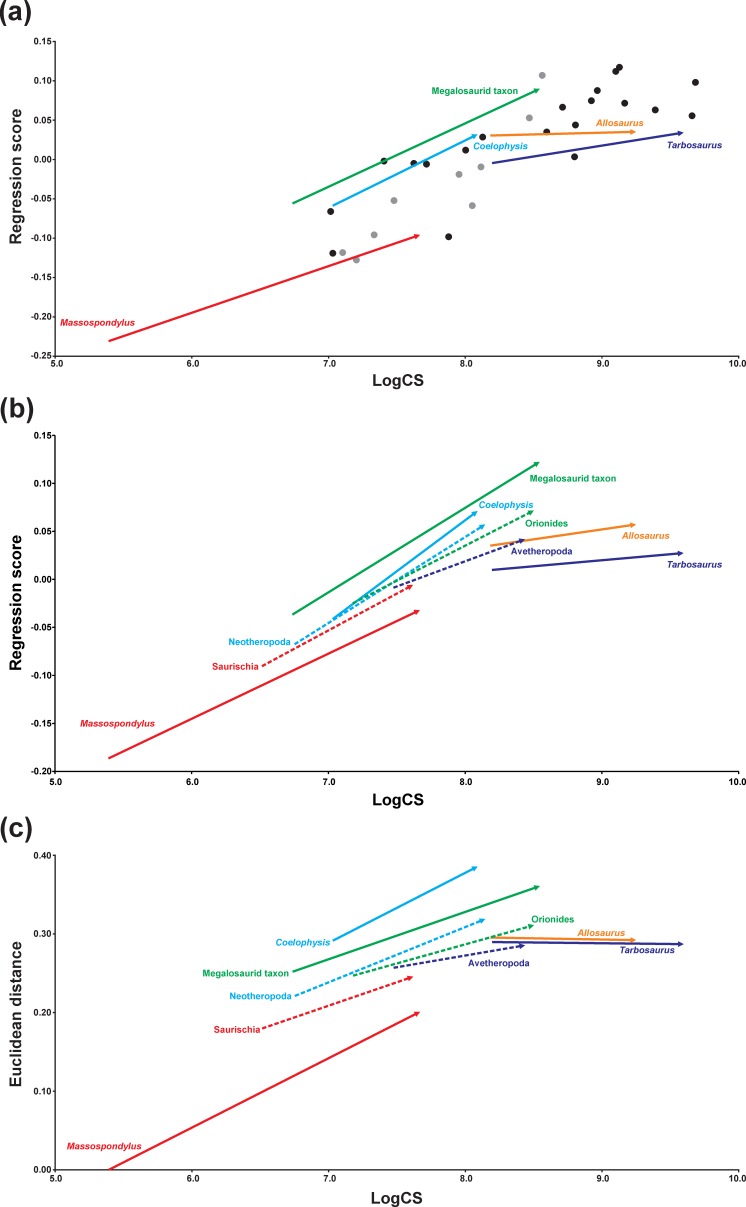
Figure 4. Centroid size regression analyses for the main sample.
(A) Regression analysis of all terminal taxa including ontogenetic trajectories against log-transformed skull centroid size (LogCS) (p < 0.0001). (B) Regression analysis of only terminal (solid arrows) and ancestral (dashed arrows) ontogenetic trajectories against log centroid size (p < 0.0001) using the regression score as shape variable. (C) Equivalent regression analysis to (B) using the Euclidean distance as shape variable. Theropod taxa are shown as black dots, while sauropodomorph taxa are shown as grey dots. The arrows illustrate the different ontogenetic trajectories, in which the arrowhead marks the position of the adult individual and the base of the arrow indicates the juvenile individual.

