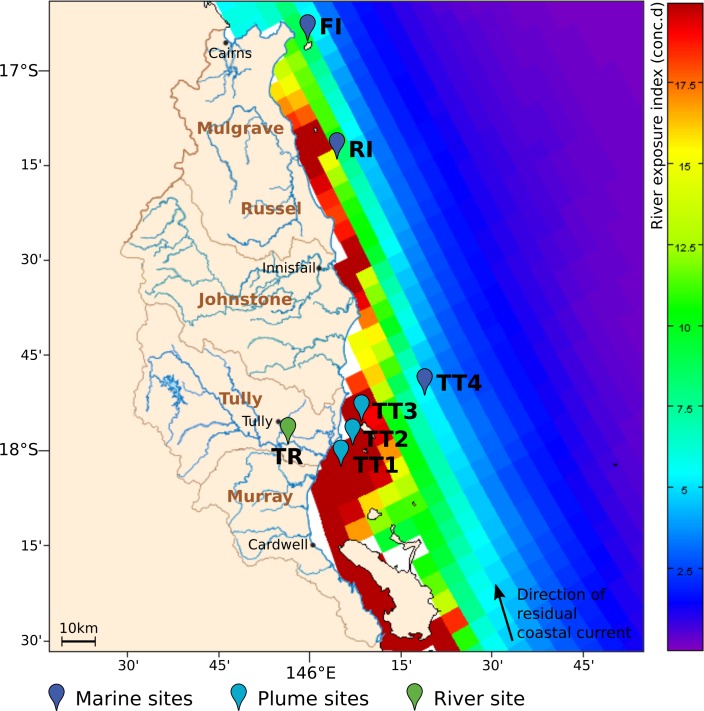
Figure 1. Overview of sampling area in the GBR lagoon.
The river exposure index is shown for the Wet Tropics river catchments in the 2010–11 wet season, with a color bar indicating clustered cumulative exposure (concentration x days) above 1% of the incoming concentration (capped at 20 conc.d). The direction of the residual coastal current is indicated as a black vector. The location of the sites surveyed for microbial composition in 2011–13 is shown as colored paddles. The sites were classified as marine, plume or riverine, according to their respective distance to the nearest influent river mouth.

