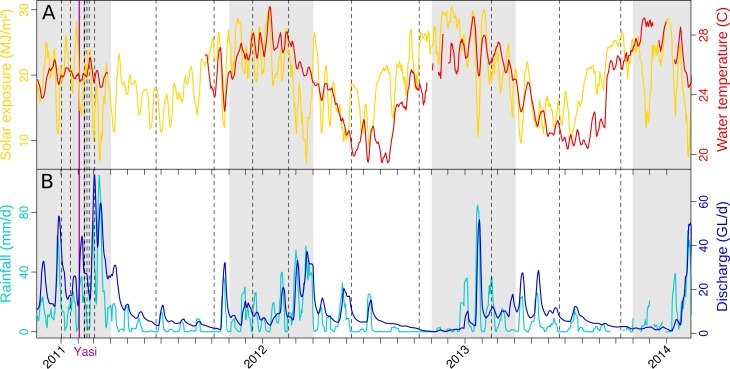
Figure 2. Weather in the Tully catchment during the years 2011–13.
(A) temperature and solar exposure, and (B) rainfall and river discharge. An average value for the previous week is reported for each day. Dashed lines indicate microbial sampling dates, and the purple line the landfall of tropical cyclone Yasi. The shading represents the extent of the wet season. Sources: BOM, DERM.

