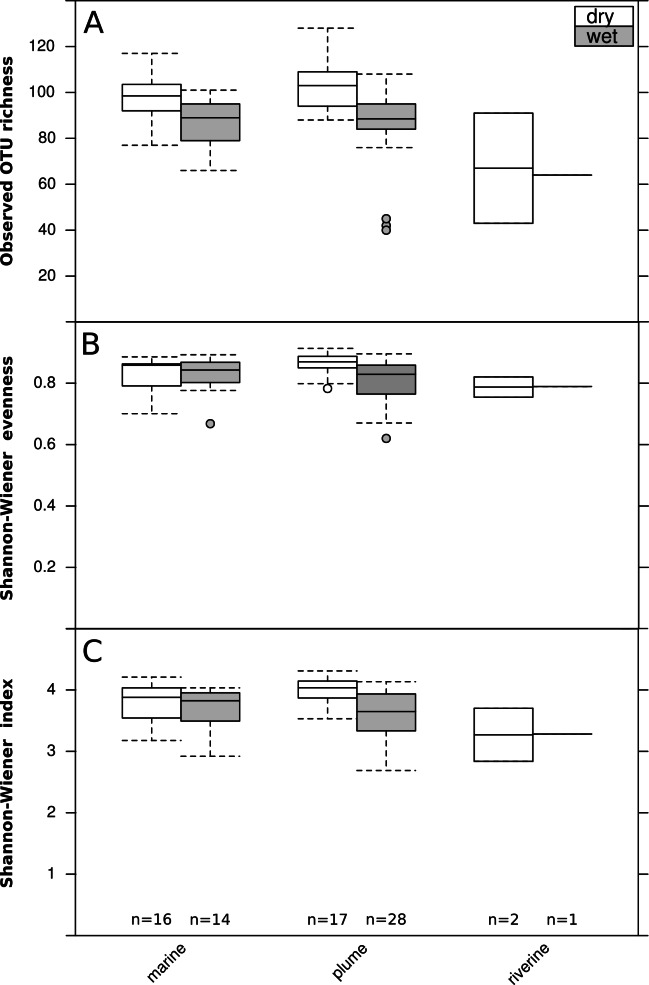
Figure 3. Seasonal and spatial differences in microbial diversity.
Boxplot of seasonal (wet or dry) and spatial (three runoff exposure categories) differences in bacterial and archaeal diversity: (A) observed OTU richness, (B) Shannon-Wiener evenness, (C) Shannon-Wiener index. Boxes represent the first quartile, median and third quartile of the data, whiskers the minimum and maximum, and circles the outliers. Blue bars show the statistical comparisons performed and significant differences are represented by a star (Mann–Whitney U test; p < 0.05).

