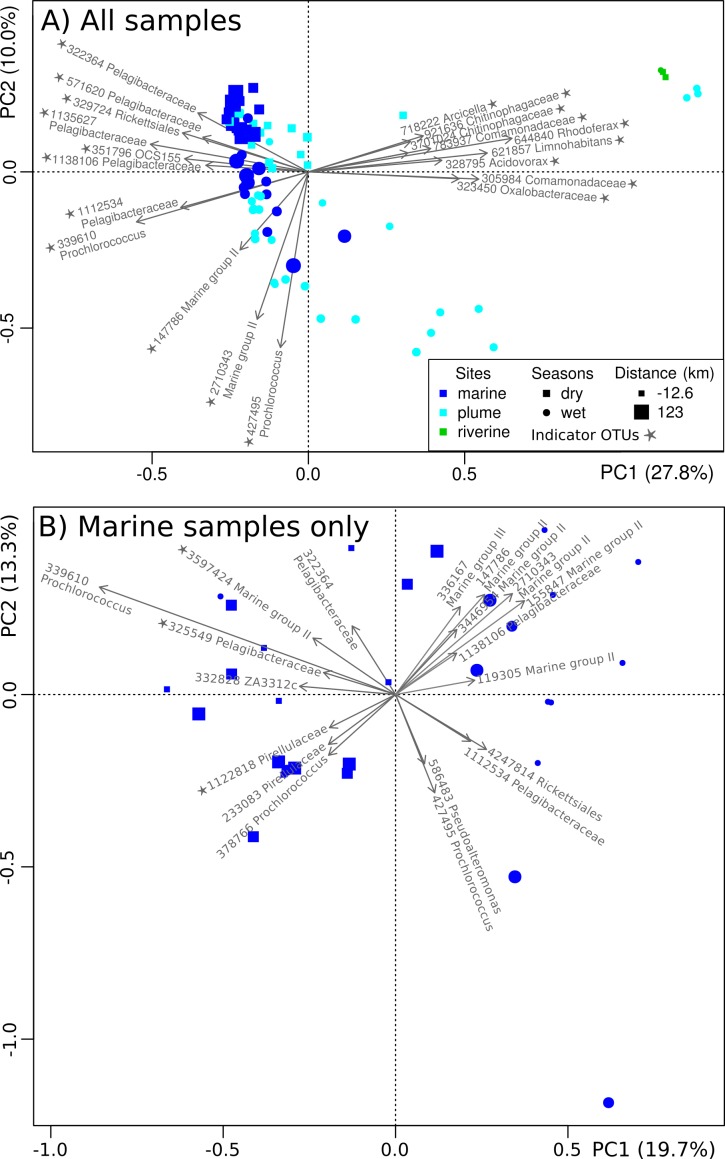
Figure 5. Spatiotemporal organization of microbial communities.
PCoA plot showing the spatiotemporal organization of microbial communities based on their Hellinger dissimilarity. Symbol color, shape and size depend on the type of site, season of collection and distance from the Tully River mouth, respectively. The OTUs explaining the largest variation are represented by arrows and their assigned Greengenes ID and genus-level taxonomy is shown. A star indicates indicator OTUs (indicator species analysis; p < 0.05).

