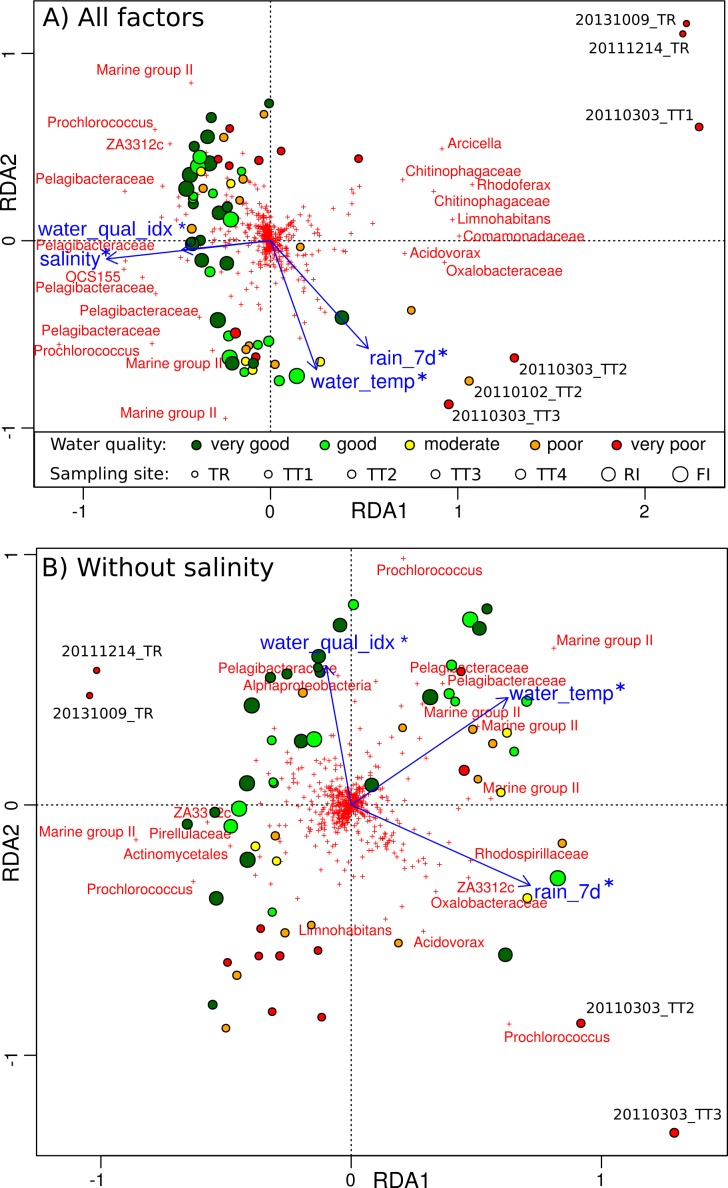
Figure 6. Relationship between environmental parameters and microbial profiles.
RDA plot showing the relationship between GBR environmental parameters and Hellinger-transformed microbial profiles: (A) for all environmental factors, and (B) with the contribution of salinity removed. Disks represent sampling sites and are colored according to the AIMS water quality index (dark green: very good, green: good, yellow: moderate, orange: poor, red: very poor). OTUs are depicted by red crosses and the genus-level Greengenes taxonomy of the most discriminating ones is shown. The factors explaining sample distribution are represented by blue arrows: rainfall in the last 7 days (rain˙7d), water temperature (water˙temp), water quality index (water˙qual˙idx) and salinity. Any significant association is indicated by a star (PERMANOVA; p < 0.05).

