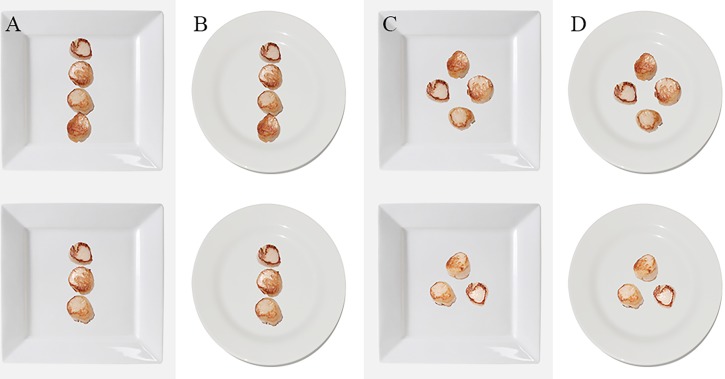
Figure 1. The 8 plates of scallops that were presented to the participants in Experiment 1.
The plates were presented in pairs (specifically, the upper and lower image in each column was compared). The plates vary systematically in terms of the number of seared scallops (3 vs. 4), the arrangement of the scallops (line vs. polygon), and the shape of the plate (round vs. angular).

