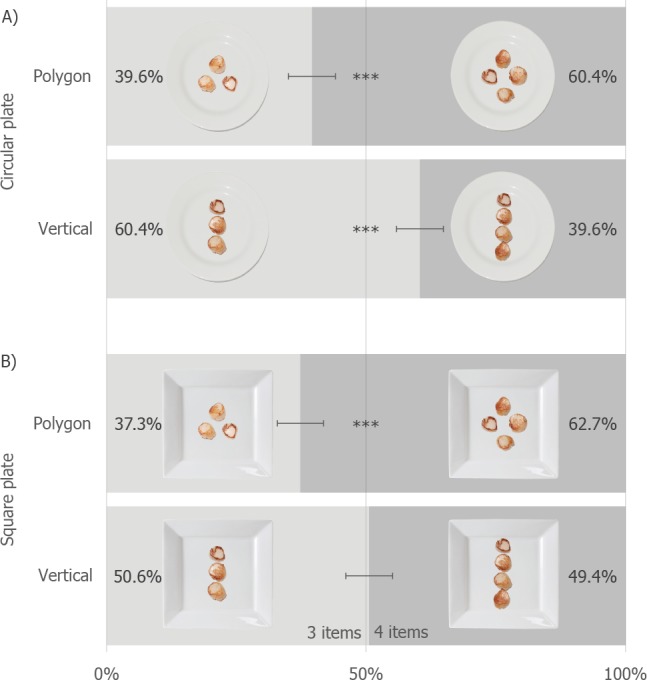
Figure 3. The percentage of people preferring one dish over the over for each of the Plate and Arrangement conditions (error bars are 95% CI, ∗∗∗ = p < .001).

The light grey shading representing preference for the 3-item dishes, and the dark grey the preference for the 4-item dishes.
