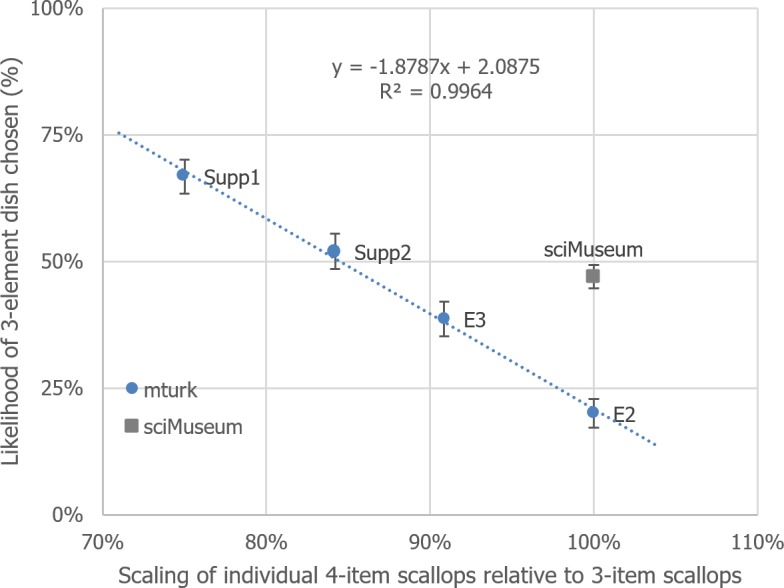
Figure 6. Depiction of the relationship between 4-item scallop scaling and likelihood of 3-scallop dish chosen, over the experiments reported so far.

Error bars represent the 95% CI derived from separate Fisher’s exact binomial tests.

Error bars represent the 95% CI derived from separate Fisher’s exact binomial tests.