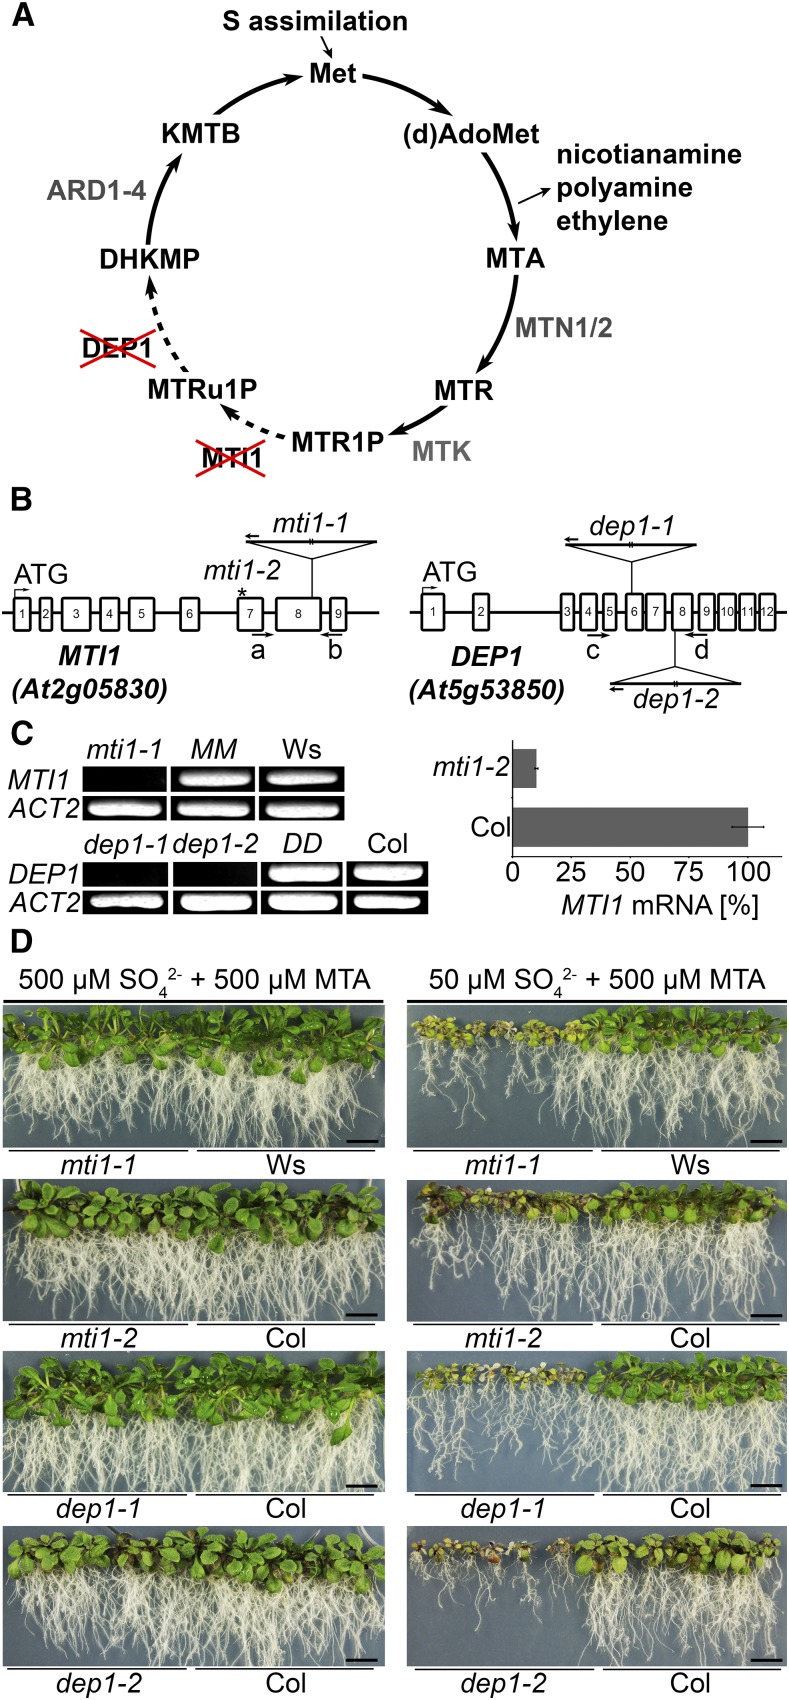
Figure 1.
Characterization of mti1 and dep1 plants as Met Cycle mutants. A, Schematic depiction of the Met Cycle. (d)AdoMet, (deoxy)S-adenosyl-Met; MTR, methylthioribose; MTR1P, MTR-1-phosphate; MTRu1P, methylthioribulose-1-phosphate; KMTB, 2-keto-4-methylthiobutyrate; MTN, MTA-NUCLEOSIDASE; MTK, MTR-KINASE; MTI1, MTR1P-ISOMERASE1; DEP1, DEHYDRATASE-ENOLASE-PHOSPHATASE-COMPLEX1; ARD, ACIDOREDUCTONE DIOXYGENASE. B, Scheme of the MTI1 and DEP1 genes and mutant alleles. The T-DNA insertions are represented as triangles. Arrows a to d represent primers used for specific amplification of MTI1 or DEP1 transcripts (see Supplemental Table S1). The asterisk marks the amiRNA binding site on the MTI1 mRNA in the analyzed mti1-2 lines. C, RT-PCR analysis of MTI1 and DEP1 mRNAs in mutants, wild-type, and complemented lines and qRT-PCR analysis of the amiRNA line mti1-2. D, Growth of 3-week-old mti1 and dep1 mutant plants together with corresponding wild-type plants on half-strength Murashige and Skoog medium with either 50 µm sulfate and 500 µm MTA or with 500 µm sulfate and 500 µm MTA as sulfur sources. Bars = 1 cm.

