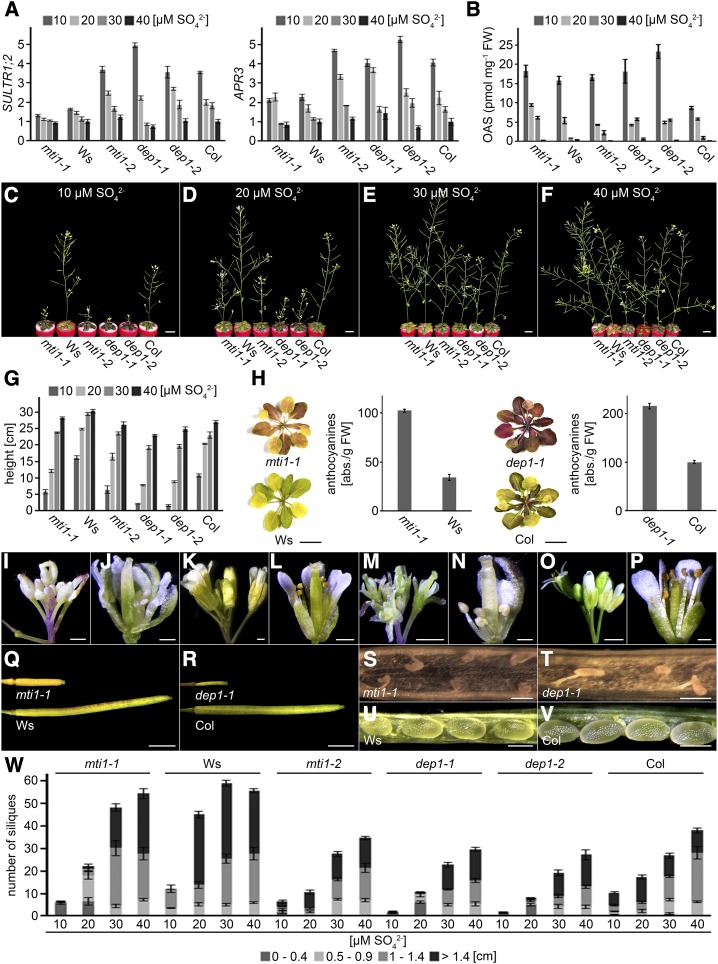
Figure 3.
Growth of mutant and wild-type lines during S deficiency. A, Relative expression of SULTR1;2 and APR3 in plants grown in Hoagland medium containing 10 to 40 µm sulfate. Bars represent mean values and standard errors calculated with data from three independent measurements. B, OAS measurements of mutant and wild-type plants grown in Hoagland medium containing 10 to 40 µm sulfate. Bars represent mean values and standard errors calculated with data from three independent measurements. C to F, Growth of 5-week-old mutant and wild-type plants in Hoagland medium containing 10 (C), 20 (D), 30 (E), or 40 µm (F) sulfate. G, Inflorescence height of mutant and wild-type plants grown in Hoagland medium containing 10 to 40 µm sulfate. Bars represent mean values and standard errors calculated with data from eight individual plants. H, Rosette leaves and their relative anthocyanin concentration of mti1-1 and Ws or dep1-1 and Col plants grown in Hoagland medium containing 10 µm sulfate. Bars represent mean values and standard errors calculated with data from three individual measurements. I to P, Flowers of mti1-1 (I and J), Ws (K and L), dep1-1 (M and N), and Col (O and P) plants grown in Hoagland medium containing 10 µm sulfate. Q and R, Closed siliques of mti1-1 and Ws plants (Q) or dep1-1 and Col plants (R) grown in Hoagland medium containing 10 µm sulfate. S to V, Opened siliques of mti1-1 (S) and Ws (U) or dep1-1 (T) and Col (V) plants grown in Hoagland medium containing 10 µm sulfate. W, Silique number and length of mutant and wild-type plants grown in Hoagland medium containing 10 to 40 µm sulfate. Siliques were grouped into four categories (0–0.4 cm, 0.5–0.9 cm, 1–1.4 cm, and >1.4 cm). Bars represent mean values and standard errors calculated with data from eight plants per genotype. Bars = 1 cm in C to F, G, and H, 1 mm in Q and R, 500 µm in I to L, U, and V, 200 µm in M to P, and 100 µm for S and T.

