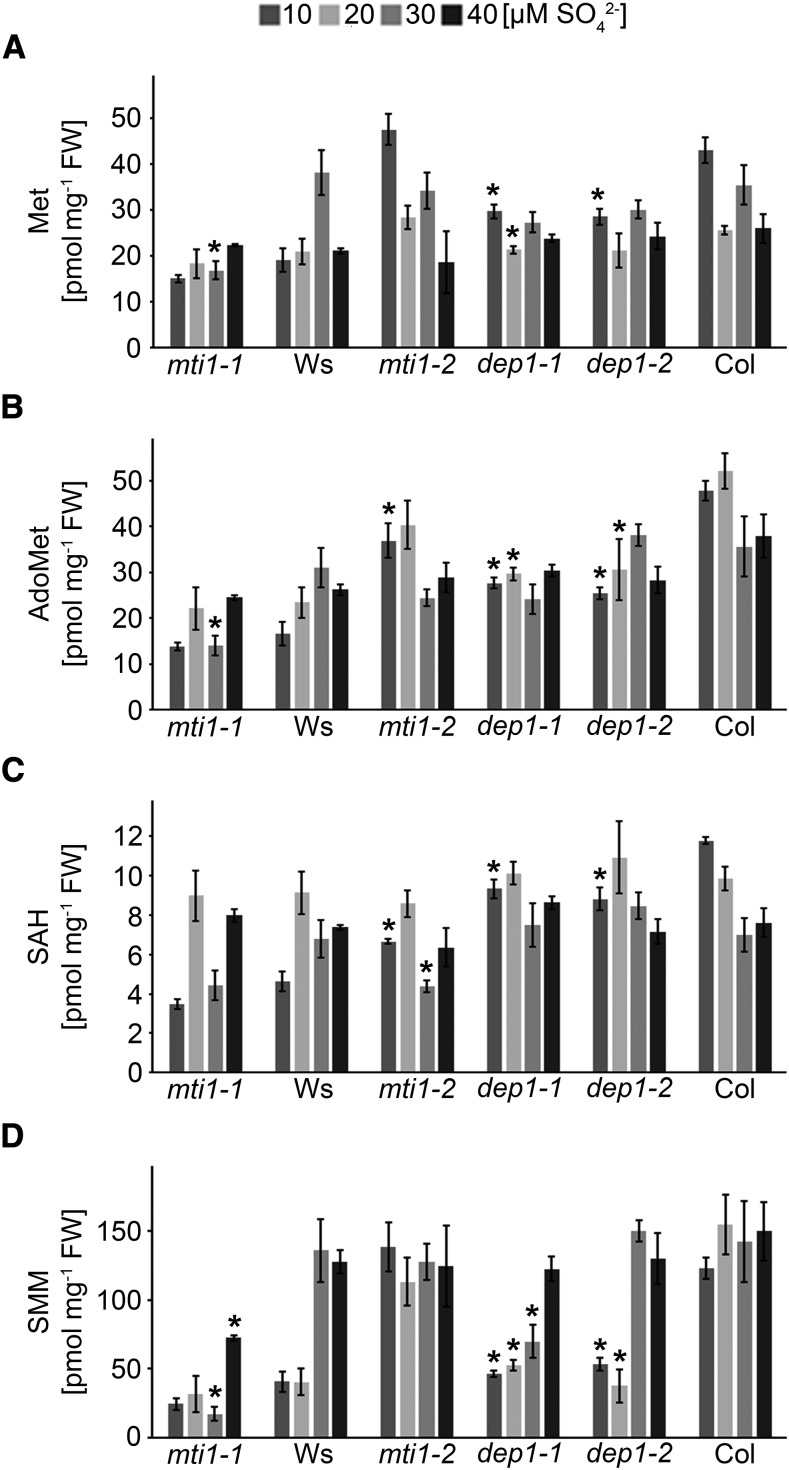
Figure 4.
Met, AdoMet, SAH, and SMM concentrations in mutant and wild-type lines. A to D, Met (A), AdoMet (B), SAH (C), and SMM (D) concentrations in inflorescences of mti1-1, Ws, mti1-2, dep1-1, dep1-2, and Col plants grown in Hoagland medium containing 10 to 40 µm sulfate. Bars represent mean values and standard errors calculated with data from three independent measurements. Significances were tested using t test with mutant and corresponding wild-type values within the same S treatment. Asterisks indicate P-values < 0.05.

