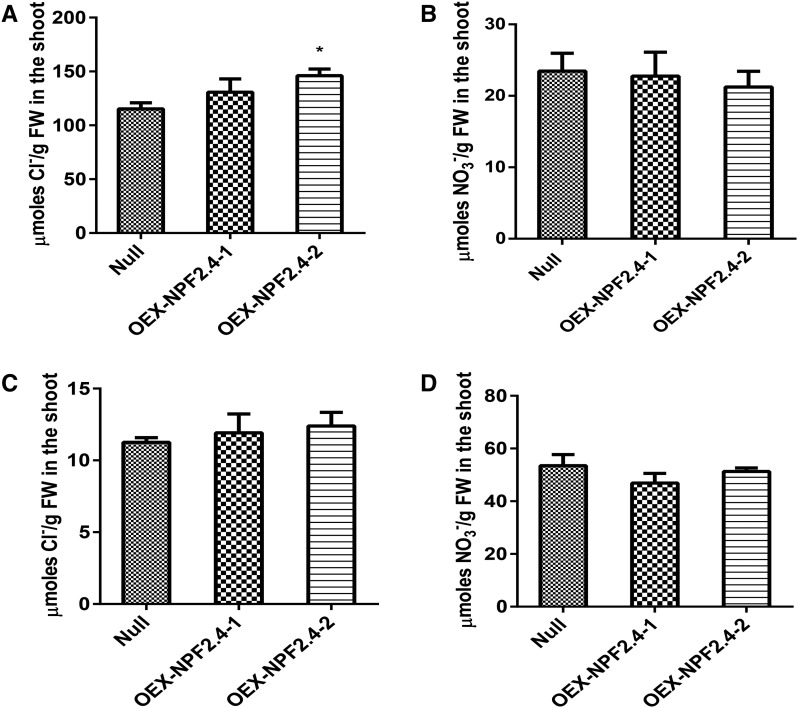
Figure 9.
Shoot accumulation of Cl– was increased in the NPF2.4 overexpression lines, while NO3− content remained unaffected. A, Cl– concentrations in the shoot of NPF2.4 overexpression lines and null segregants after high salt treatment (75 mm NaCl). B, NO3– concentrations in the shoot of NPF2.4 overexpression lines and null segregants after high salt treatment. C, Cl– concentrations in the shoot of NPF2.4 overexpression lines and null segregants after low salt treatment (2 mm NaCl). D, NO3– concentrations in the shoot of NPF2.4 overexpression lines and null segregants after low salt treatment. Error bars represent mean ± se; n = 4. Significance is indicated by the asterisks (single-factor ANOVA and Tukey test, * P ≤ 0.05).

