Figure 3.
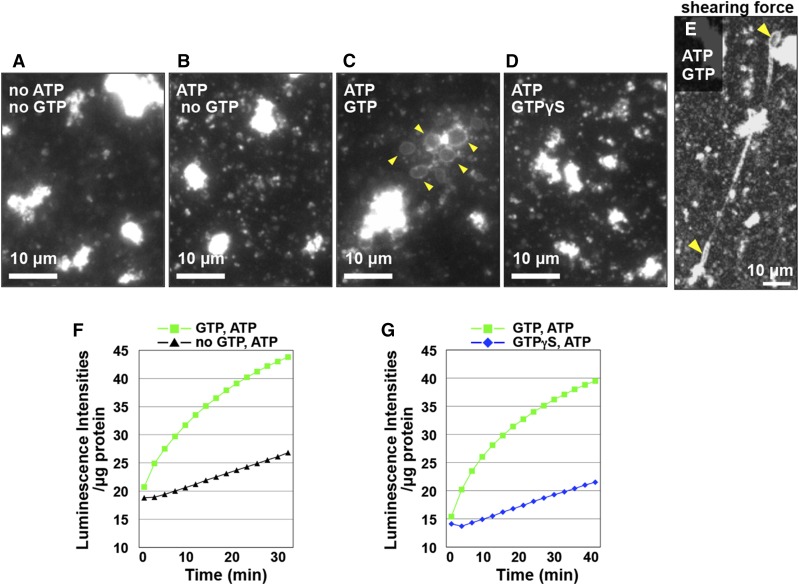
Two in vitro assay systems for ER membrane fusion with ER vesicles. A to E, In vitro ER tubule elongation assay system. Fluorescent images of ER Tracker-stained ER vesicles from cultured Arabidopsis MM2d cells. The ER vesicle preparation was incubated with ER Tracker dye for 30 min in the absence (A) or presence of nucleotides as indicated in each panel (B–D). GTPγS indicates a nonhydrolyzable GTP analog. Note that many ER sacs were generated from the ER vesicles by adding GTP and ATP (arrowheads in C). E, In vitro ER tubule elongation under a shearing force. An ER vesicle preparation was incubated with a mixture of GTP, ATP, and ER Tracker dye for 10 min and then was exposed to a shearing force on a slide glass by placing a cover glass on top. Note that ER tubules emerged from ER sacs (arrowheads) in response to the applied shearing force. F and G, Ca2+-efflux-based assay system. The calcium ion efflux produced by ER vesicles was monitored by aequorin. Luminescent intensities per microgram of protein were plotted against time after addition of ATP without or with GTP or GTPγS. Note that the luminescent intensity was significantly increased by adding GTP and ATP (green), but not by adding ATP only (black in F) or by adding ATP and GTPγS (blue in G). See Supplemental Table S2 for statistical analyses of increasing luminescent intensity in each condition.

