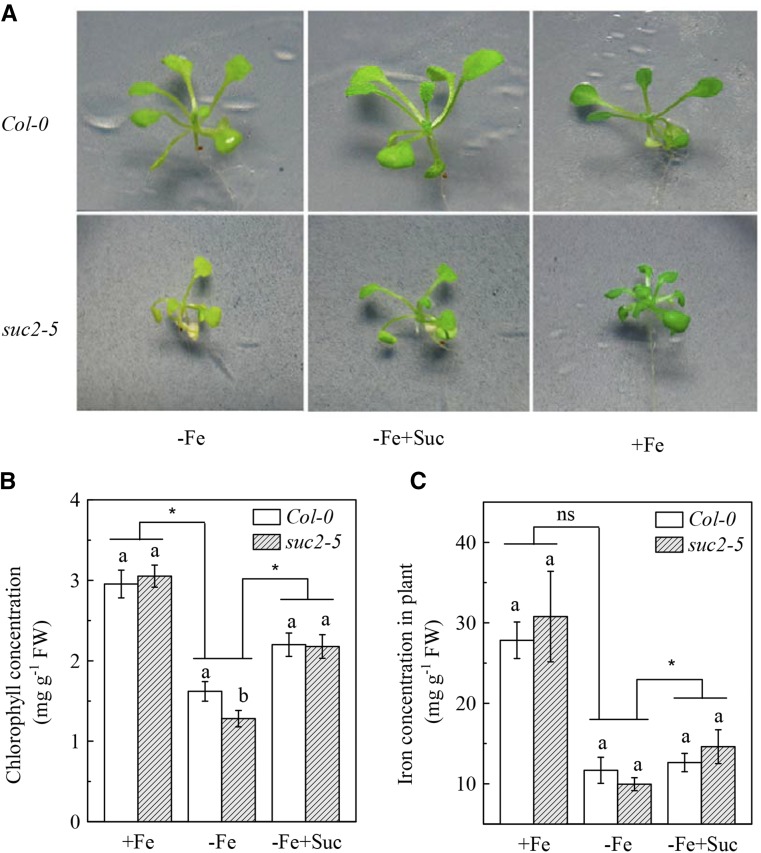
Figure 6.
Fe deficiency tolerance of Col-0 plants and the suc2-5 mutants. The indicated plants were treated as in Figure 4. A, Photographs of shoots. B, Chlorophyll concentration of leaves. C, Fe level of plants. Data are means ± sd (n = 5). Different letters indicate significant differences between two genotypes with in a treatment (one-way ANOVA, P < 0.05). Asterisk and ns indicate that the genotype by treatment interactions are significant and not significant, respectively (two-way ANOVA, P < 0.05).

