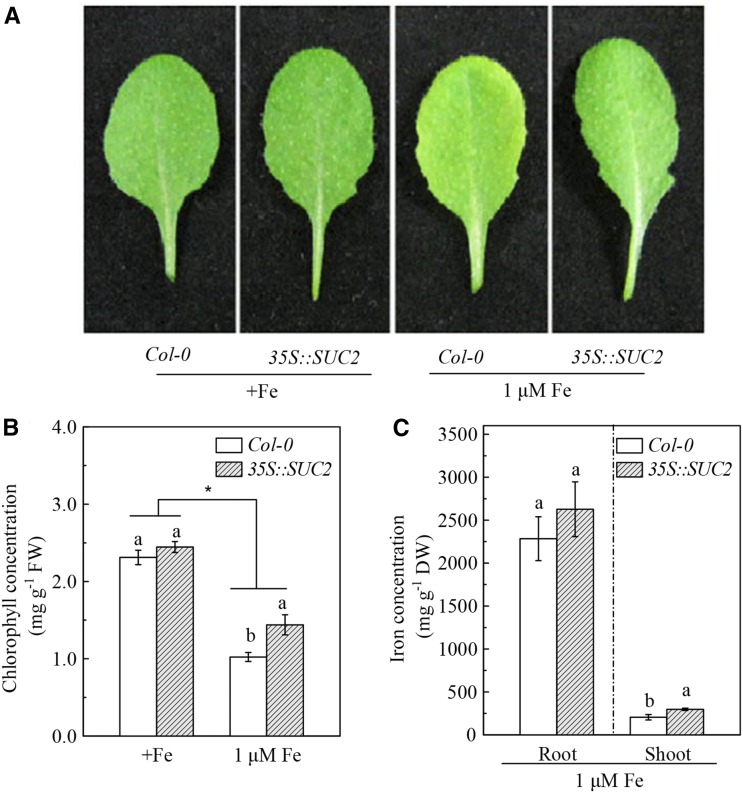
Figure 7.
Fe deficiency tolerance of Col-0 plants and the 35S::SUC2 transgenic plants. The 5-week-old plants were grown in nutrient solutions containing either 50 μm (+Fe) or 1 μm Fe-EDTA for 10 d. A, Photographs of leaves. B, Chlorophyll concentration of leaves. C, Fe level in roots and shoots. Data are means ± sd (n = 5). Different letters indicate significant differences between two genotypes with in a treatment (one-way ANOVA, P < 0.05). An asterisk shows a significant genotype by treatment interaction (two-way ANOVA, P < 0.05).

