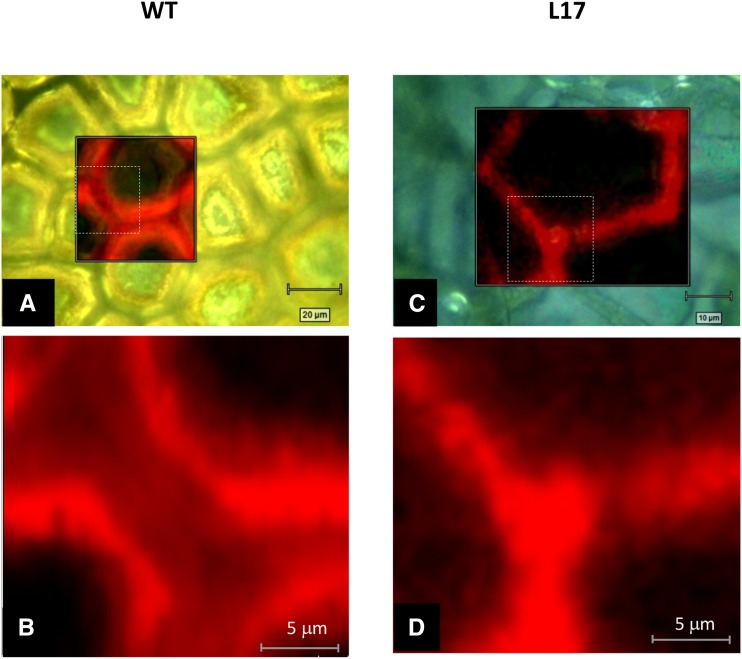
Figure 4.
Raman mapping of nonesterified OH groups within cutin polyester from tomato. Cutin from wild-type (WT; A and B) and Pro-35S:SlCUS1RNAi line L17 (D and D) red ripe fruit were benzyl etherified and analyzed by Raman microspectroscopy. Each image was obtained by mapping the characteristic band of aromatic groups at 1,001 cm−1. Images B and D correspond to higher magnification views (dashed squares) of the Raman images (A and C, respectively).

