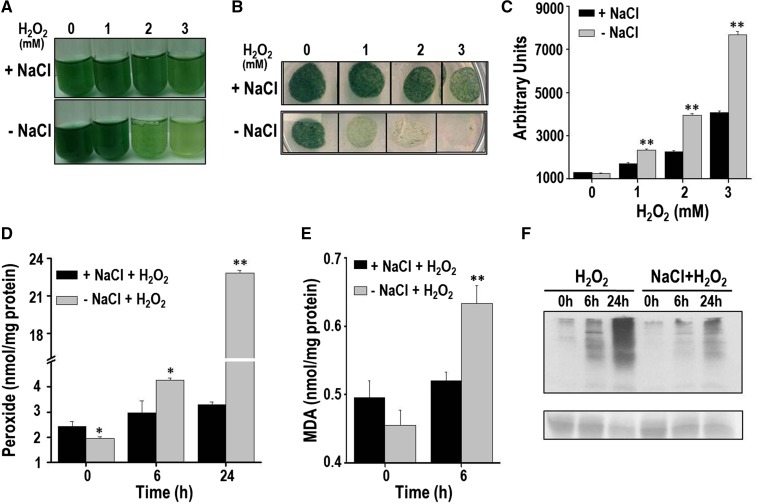
Figure 1.
H2O2 stress tolerance of the salt-pretreated Anabaena PCC 7120. A, Three-day-old Anabaena culture was reinoculated in fresh growth medium and divided into two parts. One part was treated with 100 mm NaCl (+NaCl) for 20 h, whereas the other served as the control (-NaCl). Subsequently, these cultures were stressed with different concentrations of H2O2 as indicated in the figure and photographed after 2 d. B, The above-mentioned Anabaena cultures after 2 d of treatment with H2O2 were spotted (20 μL each) on BG11 agar plate, incubated under continuous illumination, and photographed after 14 d of incubation. C, ROS production in response to H2O2. The control (-NaCl) or NaCl-treated (+NaCl) Anabaena cells were exposed to H2O2 for 16 h. Subsequently, cells were incubated with DCHFDA (10 µm final concentration) for 20 min, and fluorescence emission (λex = 490 nm, λem = 520 nm) from cells was measured immediately on a spectrofluorimeter. The relative fluorescence in arbitrary units (AUs) of both types of cultures is shown in the figure. Error bars show SE (n = 5). ** indicates significant differences at P < 0.01 compared with the corresponding control (-NaCl) cells (Student’s t test). D, Production of total peroxides in cells pretreated with NaCl (+NaCl) or control (-NaCl) cells on exposure to 1 mm H2O2. Error bars represent SE (n = 3). Asterisks indicate significant differences (*P < 0.05 and **P < 0.01) compared with the corresponding control (-NaCl) cells. E, TBARS assay to determine lipid peroxidation. The MDA produced in the control or the NaCl-pretreated cells (on exposure to H2O2) was measured at the time point indicated. Error bars represent SE (n = 3). ** indicates significant differences at P < 0.01 compared with the corresponding control (-NaCl) cells (Student’s t test). F, Detection of oxidized proteins. At the time points indicated, protein extracts were prepared from the control or +NaCl Anabaena cultures, and derivatized with dinitrophenol (DNP). Subsequently, these proteins were resolved on SDS-PAGE, transferred to nitrocellulose membrane, and probed with the monoclonal DNP antiserum. Chemiluminescent detection was performed as described in “Materials and Methods.” A Ponceau S-stained part of the blot is shown as loading control below the western blot. The experiment was repeated thrice and consistent results were obtained.

