Figure 5.
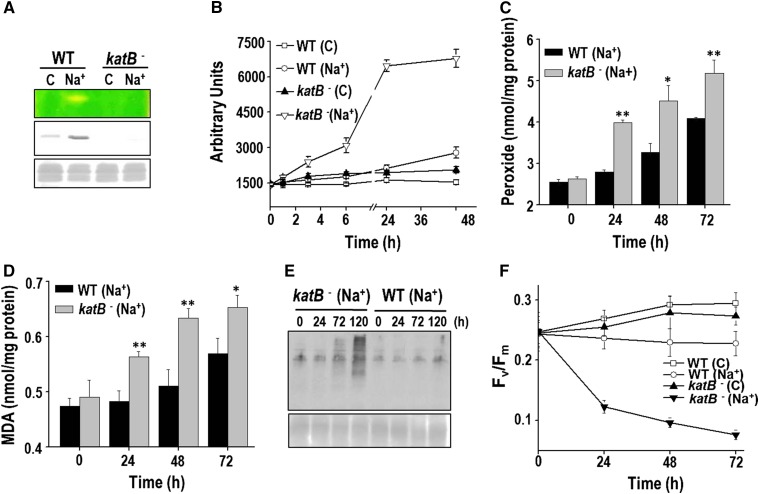
Sensitivity of the KatB mutant to salt stress. A, Catalase activity in the wild-type Anabaena (WT) cells or the katB mutant (katB-) was monitored on zymogram (top). Production of the KatB protein was monitored on western blots with the KatB antiserum (middle). The Ponceau S-stained part of the nitrocellulose membrane is shown as loading control at the bottom. C, Control cells; Na+, cells treated with NaCl. B, ROS production in response to NaCl. The wild type (WT) or the katB mutant (katB-) was treated with 100 mm NaCl, and the total ROS were measured with the fluorescent probe DCHFDA. The relative fluorescence in arbitrary units (AUs) of both types of cultures without NaCl (control, C) or in the presence of NaCl (Na+) is depicted. Error bars represent SE (n = 4). C, Production of total peroxides in cells on treatment with 100 mm NaCl. Error bars represent SE (n = 3). Asterisks indicate significant differences (*P < 0.05 and **P < 0.01) compared with the corresponding wild-type cells. D, Lipid peroxidation. The MDA produced in the wild type (WT) or the katB mutant (katB-) in response to 100 mm NaCl. Error bars show SE (n = 3). Asterisks indicate significant differences (*P < 0.05 and **P < 0.01) compared with the corresponding wild-type cells. E, Detection of oxidized proteins. Protein extracts were prepared from the two different cell types at the indicated time points and derivatized with DNP. Subsequently, these proteins were resolved on SDS-PAGE, transferred to nitrocellulose membrane, and probed with the monoclonal DNP antiserum. Chemiluminescent detection was performed as described in “Materials and Methods.” F, Changes in the Fv/Fm of the wild type or the katB mutant (katB-) in response to NaCl (100 mm). Error bars represent SE (n = 4).

