Figure 6.
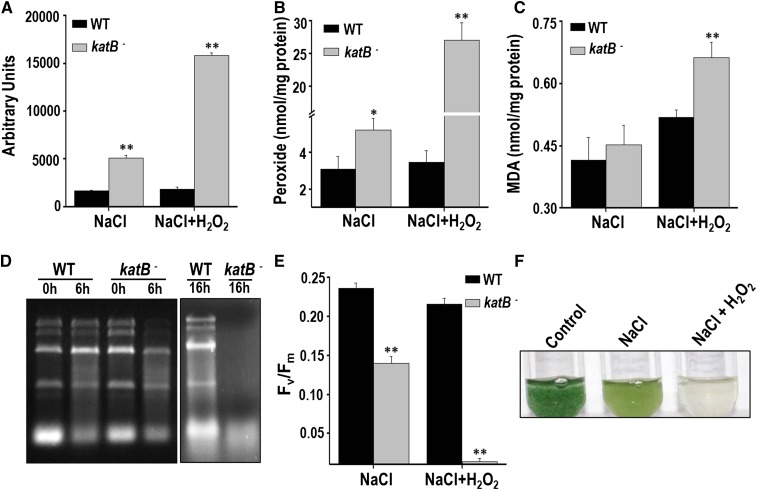
Exposure of the NaCl-treated katB- Anabaena to H2O2. The wild type (WT) or the KatB mutant (katB-) was pretreated with 100 mm NaCl for 16 h and subsequently exposed to 1 mm H2O2. A, Total ROS production at the end of 6 h was measured with DCHFDA. Error bars show SE (n = 3). ** indicates significant differences at P < 0.01 compared with the corresponding wild type. B, Production of total peroxides after 16 h of treatment with H2O2. Error bars represent SE (n = 3). Asterisks indicate significant differences (*P < 0.05 and **P < 0.01) compared with the corresponding wild type. C, Lipid peroxidation. The MDA produced in the wild type (WT) or the katB mutant (katB-) is shown. Error bars show SE (n = 3). ** indicates significant differences at P < 0.01 compared with the corresponding wild type. D, Total RNA was isolated from the NaCl-treated cells that were exposed to H2O2 for 6 or 14 h. The total RNA (5 µg) was resolved on formaldehyde-agarose gels and photographed. The experiment was repeated at least thrice and the representative image is shown. E, Fv/Fm of the NaCl-treated wild type or the katB mutant (katB-) in response to 16 h of exposure to H2O2 (1 mm). Error bars show SE (n = 5). ** indicates significant differences at P < 0.01 compared with the corresponding wild type. F, The NaCl-treated katB- was exposed to 1 mm H2O2 and photographed after 2 d.

