Figure 1.
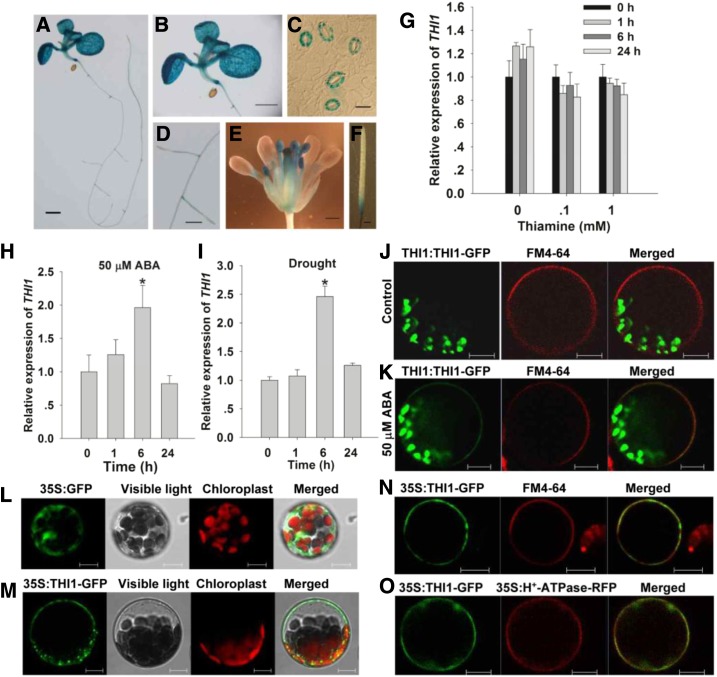
THI1 expression and the subcellular localization of THI1. A to F, GUS activity produced by pTHI1::GUS in a 10-d-old seedling (A), a leaf (B), guard cells (C), the root (D), the inflorescence (E), and the silique (F). Bars in A, B, and F = 1 mm; in C = 10 μm; and in D and E = 0.5 mm. G to I, qPCR-based assessment of THI1 induction in the presence of thiamine (G), ABA (H), and drought stress (I). Transcript levels relative to that of the reference gene ACTIN2 are presented, with each value being given in the form mean ± se (n = 3). Asterisks indicate significant differences between means (P < 0.05). J to N, The localization of THI1 in Arabidopsis leaf protoplasts harboring pTHI1::THI1-GFP in the presence of FM4-64 and control (ethanol; J), pTHI1::THI1-GFP in the presence of FM4-64 and 50 μm ABA (K), p35S::GFP (L), p35S::THI1-GFP (M), and p35S::THI1-GFP in the presence of FM4-64 (N). O, The colocalization of GFP-tagged THI1 and RFP-tagged H+-ATPase. Bars in J to O = 10 µm.

