Figure 2.
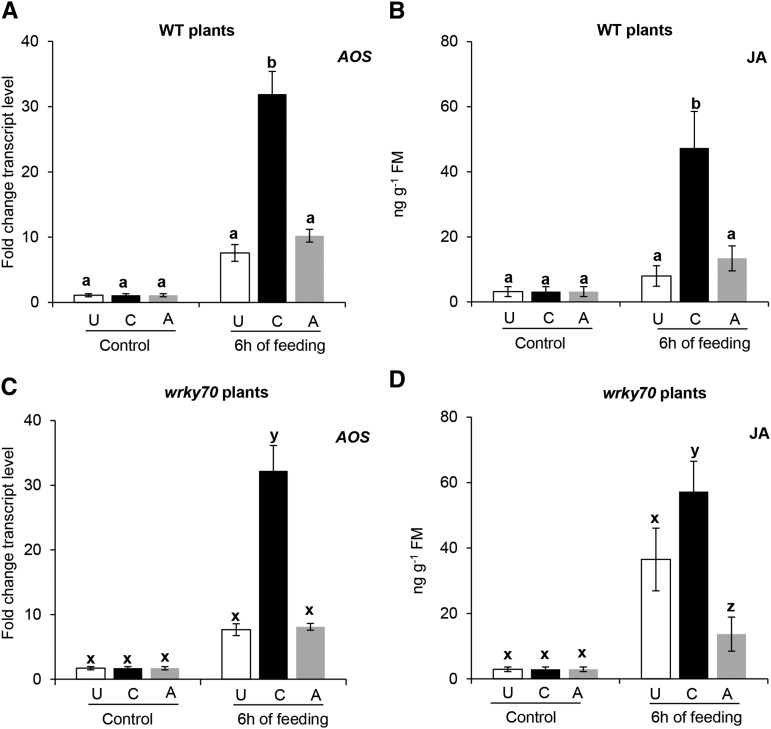
Transcript levels of AOS, a JA biosynthetic gene, and JA levels in previously unexposed (U), caterpillar-exposed (C), and aphid-exposed (A) wild-type (WT) or wrky70 plants after 6 h of subsequent P. brassicae caterpillar feeding. A and C, AOS transcript levels in unexposed, caterpillar-exposed, and aphid-exposed plants of the wild type and the wrky70 mutant after subsequent feeding by five first instar P. brassicae caterpillars. Leaves were harvested just before caterpillar introduction and after 6 h of caterpillar feeding. Relative transcript levels were analyzed by quantitative real-time PCR (RT-qPCR). Values for each time point represent means ± se (n = 5) of AOS transcript levels relative to those of the ELONGATION FACTOR-1α (EF1α) gene. B and D, JA levels in unexposed, caterpillar-exposed, and aphid-exposed plants of the wild type and the wrky70 mutant after subsequent caterpillar feeding. The same leaf samples used for AOS transcript analysis were extracted, and JA levels were quantified by liquid chromatography quadrupole tandem mass spectrometry (LC-MS) using deuterium-labeled JA as an internal standard. Each graph shows means ± se (n = 5) of the JA level in wild-type and wrky70 plants. JA levels in wild-type and wrky70 plants from the same treatment were compared by Student’s t test. AOS expression and JA levels were compared among unexposed, caterpillar-exposed, and aphid-exposed treatments within the same genotype (wild-type or wrky70 plants) using one-way ANOVA followed by Tukey’s HSD posthoc test; different letters indicate significant differences within a plant genotype (P ≤ 0.05). FM, Fresh mass.

