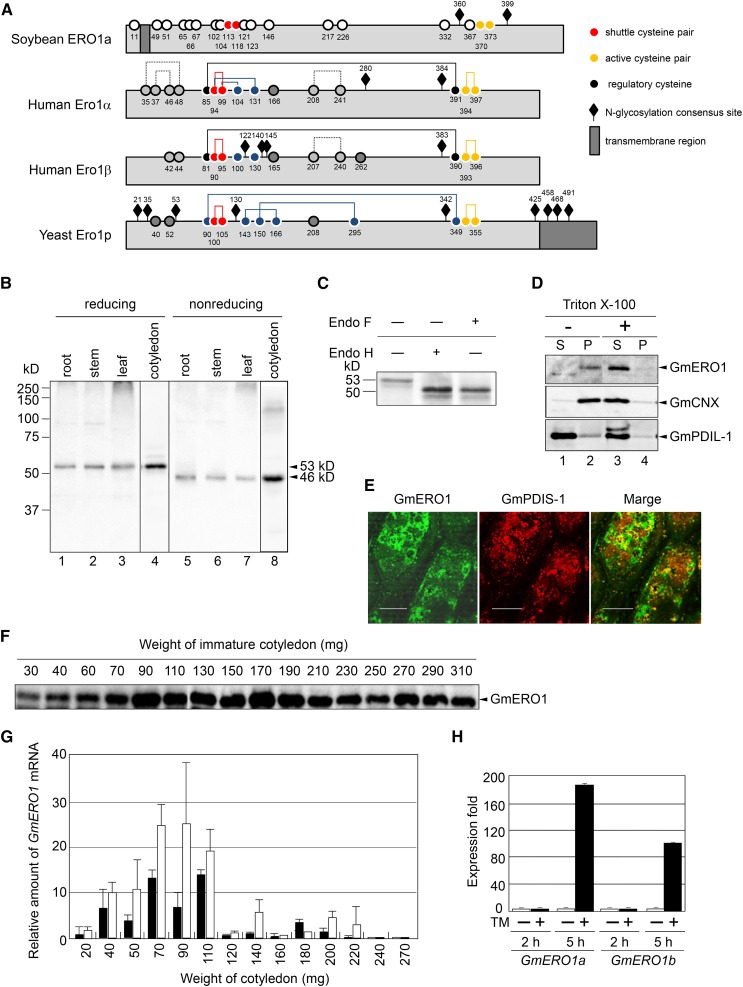
Figure 1.
Identification of soybean Ero1. A, Schematic representation of Ero1 orthologs. Numbered circles represent the positions of the Cys residues. Lines indicate disulfide bonds. B, GmERO1 is ubiquitously expressed in tissues. The proteins extracted from root (4.5 μg protein; lanes 1 and 5), stem (10 μg protein; lanes 2 and 6), leaf (30 μg protein; lanes 3 and 7), and immature cotyledon (100 mg, 30 μg protein; lanes 4 and 8) were separated under reducing (lanes 1–4) and nonreducing SDS-PAGE (lanes 5–8) and subjected to western-blot analysis with an antiserum prepared against recombinant GmERO1a. C, GmERO1 is N-glycosylated. GmERO1 in the immature cotyledon (30 mg) was detected by western-blot analysis with the anti-GmERO1 serum after treatment with (+) or without (−) endoglycosidase H (Endo H) or endoglycosidase F (Endo F). The 53-kD band of GmERO1 was shifted to 50 kD after Endo H and Endo F treatment. D, GmERO1 is a membrane-bound protein. An immature cotyledon (100 mg) was homogenized by sonication. The homogenate was centrifuged at 100,000g for 2 h at 4°C in the absence (−; lanes 1 and 2) or presence (+) of 1% Triton X-100 (lanes 3 and 4). GmERO1 protein in the supernatant (S; lanes 1 and 3) and pellet (P; lanes 2 and 4) was detected by western-blot analysis with anti-GmERO1 serum, GmCNX serum, or anti-GmPDIL-1 serum. E, GmERO1 localizes in the ER. The immature cotyledon (195 mg) was fixed and embedded in resin. The sections were cut with a microtome and immunostained with anti-GmERO1 guinea pig serum and anti-GmPDIS-1 rabbit serum, and observed under a confocal microscope. Bars = 20 μm. F, Expression of GmERO1 in cotyledons during development. The proteins (25 μg) extracted from cotyledons were analyzed by western blot with anti-GmERO1a serum. G, Relative amounts of GmERO1a (black bars) and GmERO1b (white bars) mRNA in cotyledons during development were quantified by real-time PCR. Data are represented as mean ± se of n = 3. H, Expression levels of GmERO1a and GmERO1b mRNA are up-regulated under ER stress. Young soybean leaves were treated with (+, black bars) or without (−, white bars) 5 μg/mL TM for 2 or 5 h. After treatment, GmERO1a and GmERO1b mRNA were quantified by real-time PCR. Data are represented as mean ± se of n = 3. TM, tunicamycin.

