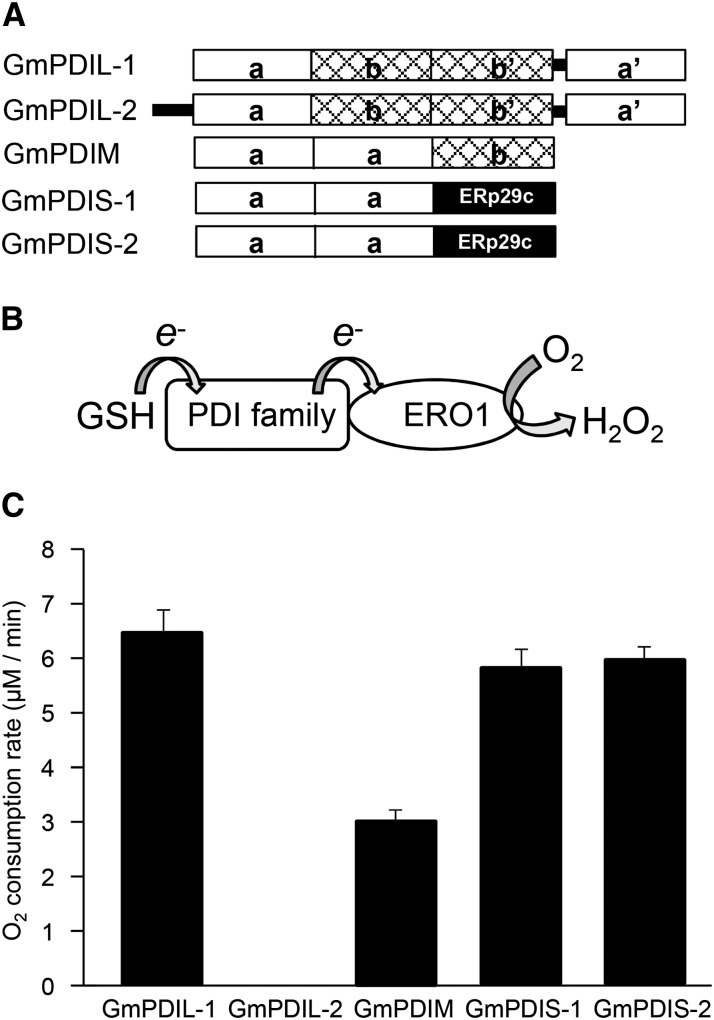
Figure 3.
GmERO1a shows broad specificity for ER oxidoreductases. A, Schematic representation of soybean ER oxidoreductases. Boxes represent domains. B, Schematic representation of the continuous oxidation of PDI family members by Ero1 in the presence of GSH and the reduction of O2. C, Oxygen consumption rate of GmERO1a (1 μm) in the presence of 3 μm each ER oxidoreductase and 10 mm GSH at 25°C. Data are represented as mean ± se of n = 3.

