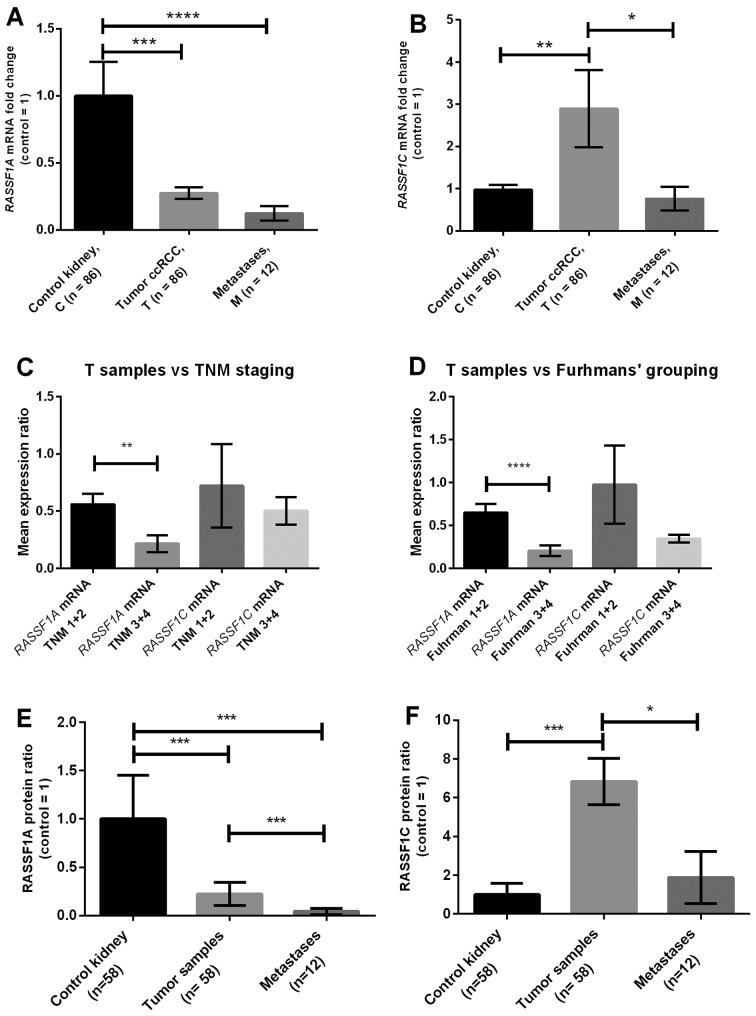
Figure 1.
RASSF1A and RASSF1C gene expression in ccRCC. (A) RASSF1A and (B) RASSF1C mRNA levels in tissue samples of ccRCC patients were assessed by qPCR. (C) Plots and (D) show gene expression in tumor samples related to TNM and Fuhrman's grading. (E and F) RASSF1A and RASSF1C protein levels assessed by western blot analysis. Bars and whiskers represent mean ± SEM normalized to control kidney samples. *P<0.05; **P<0.01; ***P<0.001; ****P< 0.0001 between groups (Mann-Whitney U test).

