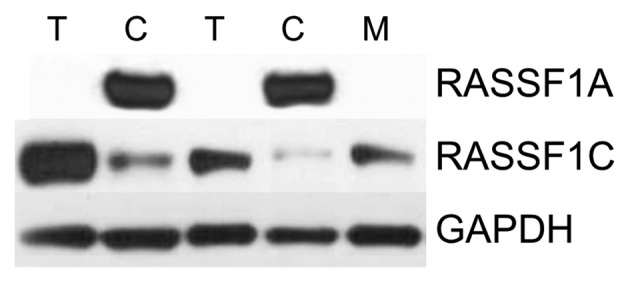
Figure 4.

Analysis of RASSF1A and RASSF1C proteins in ccRCC by western blot analysis. Semi-quantitative analysis of RASSF1A and RASSF1C proteins in tumor (T), control kidney (C ) and metastasized (M) samples normalized to GAPDH protein level. Lines 1 and 2 represent biopsies from patient characterized by TNM 3 and Fuhrman's 2 grade, whereas lines 3–5 represent biopsies from patient with TNM 4, Fuhrman's 3 grade.
