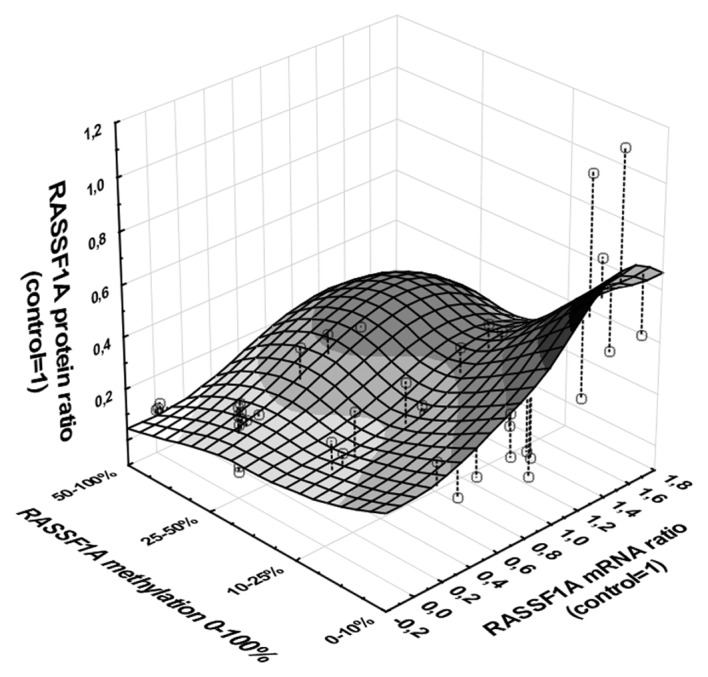
Figure 5.

Association between RASSF1A promoter methylation and expression at mRNA and protein levels in ccRCC tumor samples. Graphic presentation of multivariate regression analysis of RASSF1A expression pattern; promoter methylation, mRNA level and protein level. XYZ plot represent results of 58 T, C and 12 M biopsies; single results are shown by empty dots. Darkening area represents increasing association between variables (white area for <0.1 association to black area for >0.7 association). Regression analysis with methylation as an independent variable: b=−0.63, P<0.001.
