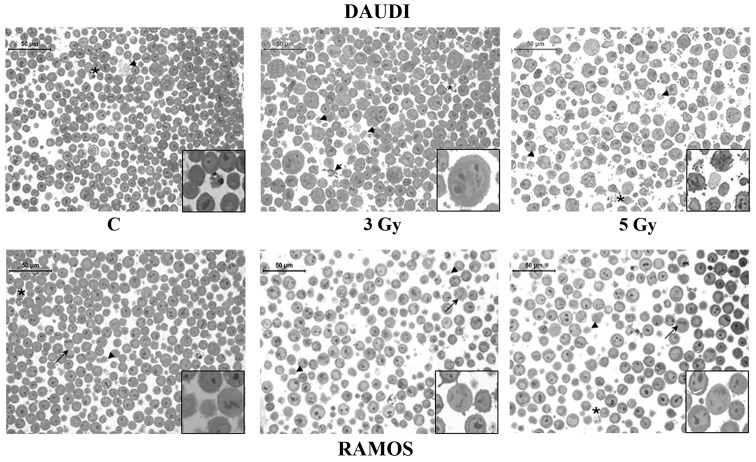
Figure 2.
Morphologic analysis of Daudi cells and Ramos cells. Toluidine blue-stained semithin sections showing apoptotic and necrotic features at 24 h in Daudi cells and Ramos cells left unirradiated (C) or exposed to 3 and 5-Gy IR doses, as indicated. Arrowheads (▶) point at necrotic cells, asterisks (*) at apoptotic cells, and arrows (→) at mitotic cells. Representative fields of 1 out of 3 different experiments are shown. Original magnification, ×40. Scale bar, 50 μm. The insets show the different sample features at a higher magnification (×80).

